| Red | Green | Blue | |
| z | 17.64 | ||
| znorm | Inf | ||
| sky | -Inf | -Inf | -Inf |
| S/N | 16.8 | 32.2 | 34.1 |
| S/N(c) | 0.0 | 0.0 | 0.0 |
| SN(E/C) |
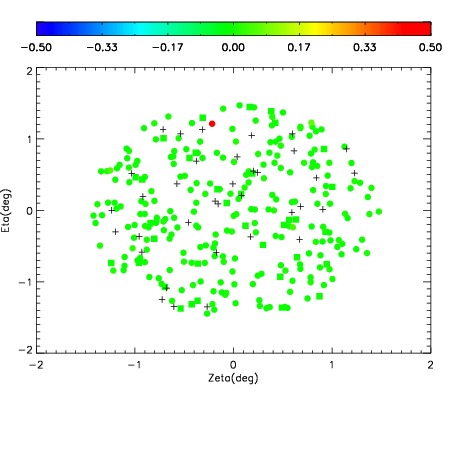
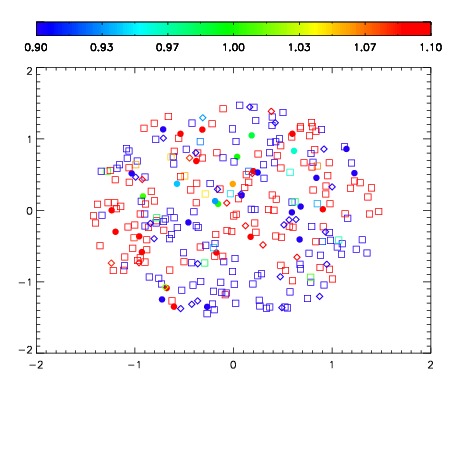
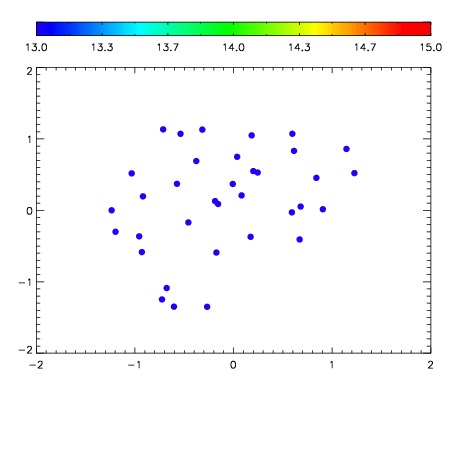

| Frame | Nreads | Zeropoints | Mag plots | Spatial mag deviation | Spatial sky 16325A emission deviations (filled: sky, open: star) | Spatial sky continuum emission | Spatial sky telluric CO2 absorption deviations (filled: H < 10) | |||||||||||||||||||||||
| 0 | 0 |
|
|
|
|
|
|
| IPAIR | NAME | SHIFT | NEWSHIFT | S/N | NAME | SHIFT | NEWSHIFT | S/N |
| 0 | 08470073 | 0.489901 | 0.00000 | 160.227 | 08470074 | 0.00455256 | 0.485348 | 167.701 |
| 1 | 08470072 | 0.488705 | 0.00119600 | 159.636 | 08470078 | 0.00377801 | 0.486123 | 164.693 |
| 2 | 08470077 | 0.489400 | 0.000501007 | 150.398 | 08470071 | 0.00000 | 0.489901 | 159.519 |
| 3 | 08470076 | 0.488193 | 0.00170800 | 146.433 | 08470075 | 0.00250136 | 0.487400 | 156.391 |