| Red | Green | Blue | |
| z | 17.64 | ||
| znorm | Inf | ||
| sky | -Inf | -Inf | -Inf |
| S/N | 26.1 | 45.7 | 50.0 |
| S/N(c) | 0.0 | 0.0 | 0.0 |
| SN(E/C) |
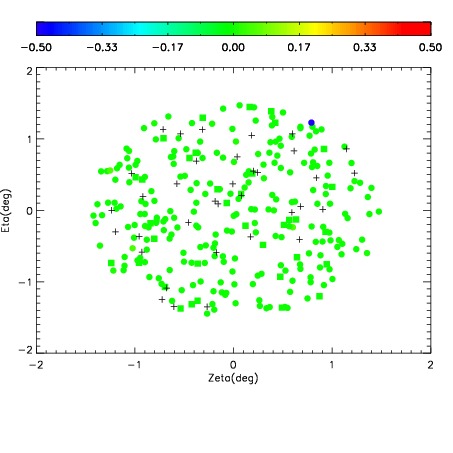
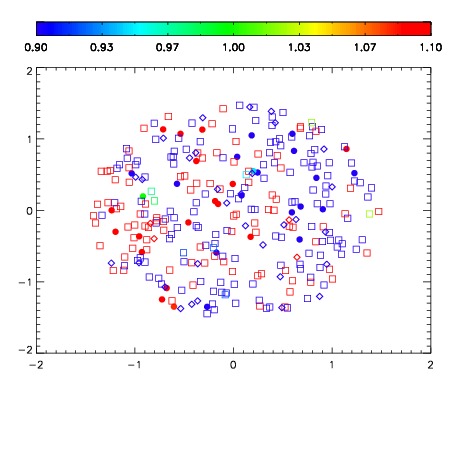
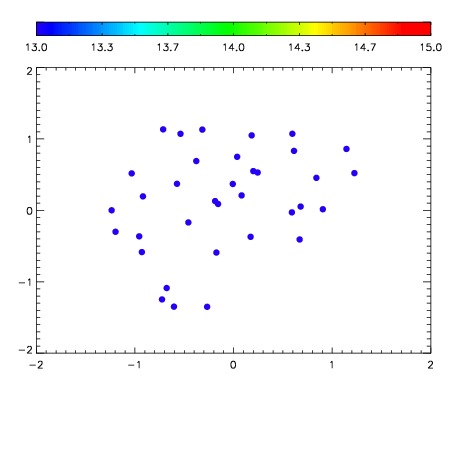

| Frame | Nreads | Zeropoints | Mag plots | Spatial mag deviation | Spatial sky 16325A emission deviations (filled: sky, open: star) | Spatial sky continuum emission | Spatial sky telluric CO2 absorption deviations (filled: H < 10) | |||||||||||||||||||||||
| 0 | 0 |
|
|
|
|
|
|
| IPAIR | NAME | SHIFT | NEWSHIFT | S/N | NAME | SHIFT | NEWSHIFT | S/N |
| 0 | 08490028 | 0.485452 | 0.00000 | 206.562 | 08490030 | 0.00292344 | 0.482529 | 204.512 |
| 1 | 08490032 | 0.484517 | 0.000934988 | 213.626 | 08490033 | 0.00414678 | 0.481305 | 213.530 |
| 2 | 08490031 | 0.483884 | 0.00156799 | 207.119 | 08490026 | 0.00000 | 0.485452 | 208.245 |
| 3 | 08490027 | 0.485176 | 0.000275999 | 204.327 | 08490029 | 0.00332734 | 0.482125 | 204.485 |