| Red | Green | Blue | |
| z | 17.64 | ||
| znorm | Inf | ||
| sky | -Inf | -Inf | -Inf |
| S/N | 23.5 | 42.2 | 47.0 |
| S/N(c) | 0.0 | 0.0 | 0.0 |
| SN(E/C) |
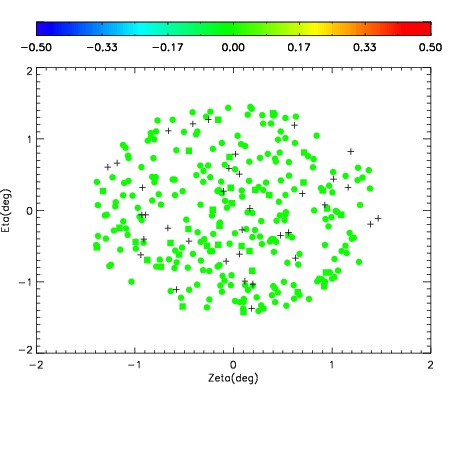
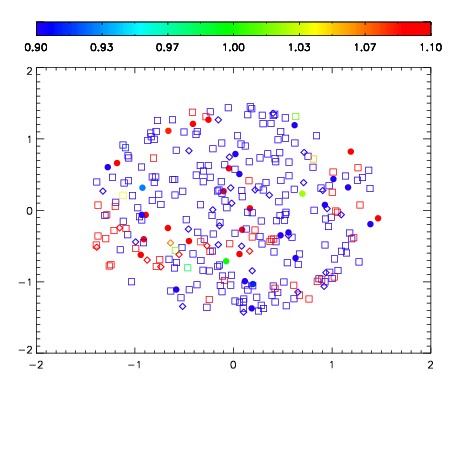
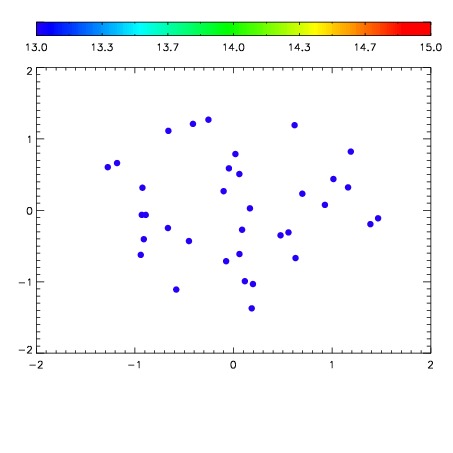

| Frame | Nreads | Zeropoints | Mag plots | Spatial mag deviation | Spatial sky 16325A emission deviations (filled: sky, open: star) | Spatial sky continuum emission | Spatial sky telluric CO2 absorption deviations (filled: H < 10) | |||||||||||||||||||||||
| 0 | 0 |
|
|
|
|
|
|
| IPAIR | NAME | SHIFT | NEWSHIFT | S/N | NAME | SHIFT | NEWSHIFT | S/N |
| 0 | 08420060 | 0.486680 | 0.00000 | 203.294 | 08420059 | 0.00000 | 0.486680 | 209.472 |
| 1 | 08420064 | 0.485433 | 0.00124699 | 217.983 | 08420066 | 0.00105374 | 0.485626 | 216.104 |
| 2 | 08420065 | 0.485238 | 0.00144202 | 217.949 | 08420063 | 0.00311701 | 0.483563 | 210.406 |
| 3 | 08420061 | 0.485853 | 0.000827014 | 201.330 | 08420062 | 0.00498175 | 0.481698 | 201.151 |