| Red | Green | Blue | |
| z | 17.64 | ||
| znorm | Inf | ||
| sky | -Inf | -Inf | -Inf |
| S/N | 22.9 | 41.5 | 47.4 |
| S/N(c) | 0.0 | 0.0 | 0.0 |
| SN(E/C) |
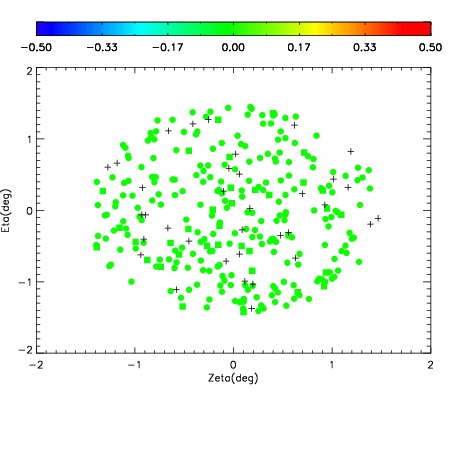
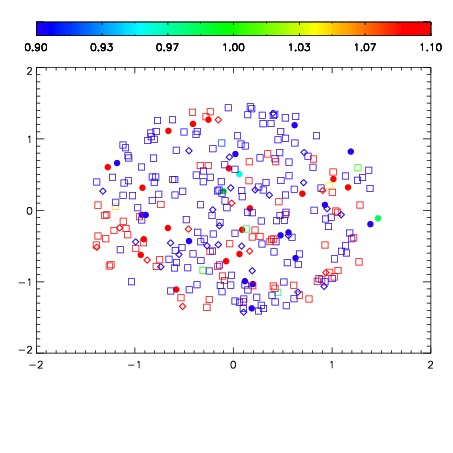
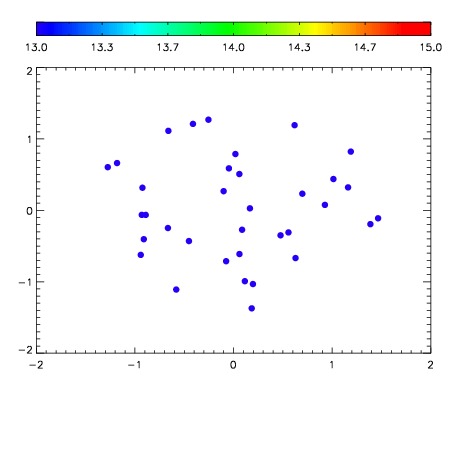

| Frame | Nreads | Zeropoints | Mag plots | Spatial mag deviation | Spatial sky 16325A emission deviations (filled: sky, open: star) | Spatial sky continuum emission | Spatial sky telluric CO2 absorption deviations (filled: H < 10) | |||||||||||||||||||||||
| 0 | 0 |
|
|
|
|
|
|
| IPAIR | NAME | SHIFT | NEWSHIFT | S/N | NAME | SHIFT | NEWSHIFT | S/N |
| 0 | 08480059 | 0.485200 | 0.00000 | 188.531 | 08480064 | 0.000857193 | 0.484343 | 193.705 |
| 1 | 08480062 | 0.482641 | 0.00255898 | 190.879 | 08480060 | 0.00164005 | 0.483560 | 194.295 |
| 2 | 08480058 | 0.484740 | 0.000459999 | 187.260 | 08480061 | 0.000493034 | 0.484707 | 192.660 |
| 3 | 08480063 | 0.483370 | 0.00182998 | 187.144 | 08480057 | 0.00000 | 0.485200 | 184.531 |