| Red | Green | Blue | |
| z | 17.64 | ||
| znorm | Inf | ||
| sky | -Inf | -Inf | -Inf |
| S/N | 21.8 | 40.1 | 44.0 |
| S/N(c) | 0.0 | 0.0 | 0.0 |
| SN(E/C) |
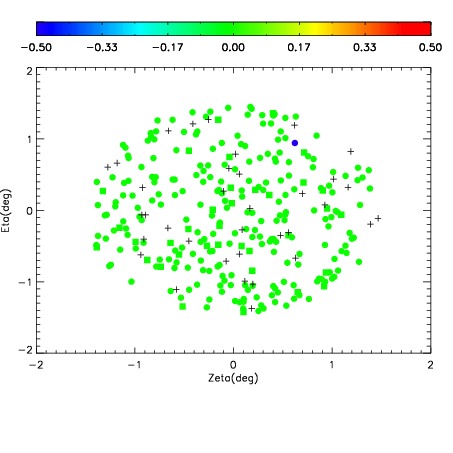
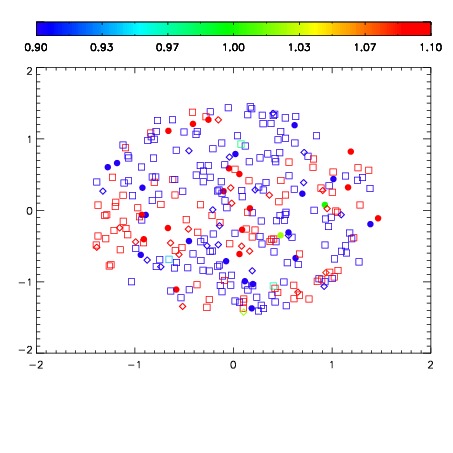
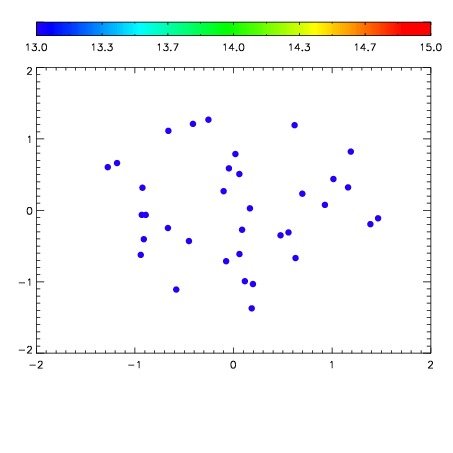

| Frame | Nreads | Zeropoints | Mag plots | Spatial mag deviation | Spatial sky 16325A emission deviations (filled: sky, open: star) | Spatial sky continuum emission | Spatial sky telluric CO2 absorption deviations (filled: H < 10) | |||||||||||||||||||||||
| 0 | 0 |
|
|
|
|
|
|
| IPAIR | NAME | SHIFT | NEWSHIFT | S/N | NAME | SHIFT | NEWSHIFT | S/N |
| 0 | 11470061 | 0.479256 | 0.00000 | 236.206 | 11470055 | 0.00000 | 0.479256 | 228.117 |
| 1 | 11470060 | 0.478462 | 0.000793993 | 251.316 | 11470059 | -0.00130633 | 0.480562 | 252.620 |
| 2 | 11470056 | 0.477308 | 0.00194800 | 238.176 | 11470058 | -0.000989728 | 0.480246 | 245.553 |
| 3 | 11470057 | 0.477253 | 0.00200301 | 235.199 | 11470062 | -0.000554087 | 0.479810 | 181.122 |