| Red | Green | Blue | |
| z | 17.64 | ||
| znorm | Inf | ||
| sky | -Inf | -Inf | -Inf |
| S/N | 27.0 | 48.7 | 54.2 |
| S/N(c) | 0.0 | 0.0 | 0.0 |
| SN(E/C) |

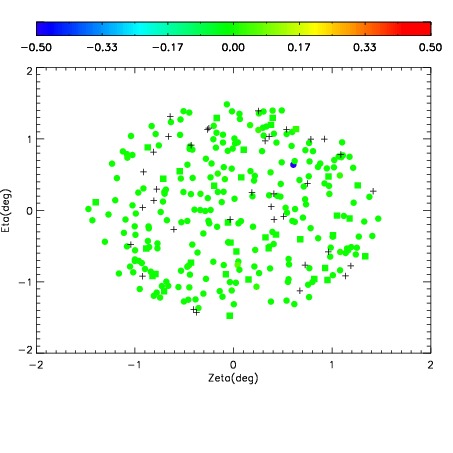

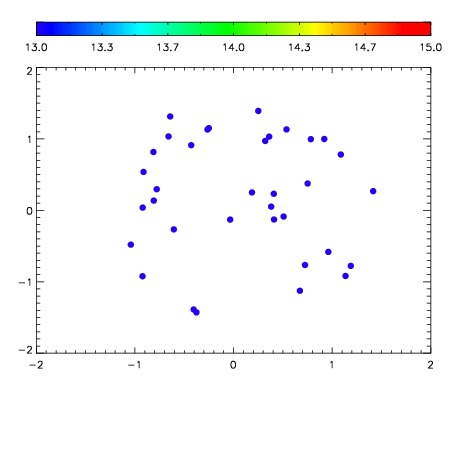

| Frame | Nreads | Zeropoints | Mag plots | Spatial mag deviation | Spatial sky 16325A emission deviations (filled: sky, open: star) | Spatial sky continuum emission | Spatial sky telluric CO2 absorption deviations (filled: H < 10) | |||||||||||||||||||||||
| 0 | 0 |
|
|
|
|
|
|
| IPAIR | NAME | SHIFT | NEWSHIFT | S/N | NAME | SHIFT | NEWSHIFT | S/N |
| 0 | 08160038 | 0.510837 | 0.00000 | 229.358 | 08160040 | -0.00342460 | 0.514262 | 231.067 |
| 1 | 08160041 | 0.500281 | 0.0105560 | 229.730 | 08160039 | -0.00303322 | 0.513870 | 231.420 |
| 2 | 08160042 | 0.508672 | 0.00216502 | 228.415 | 08160043 | -0.00239157 | 0.513229 | 229.160 |
| 3 | 08160037 | 0.503683 | 0.00715405 | 227.290 | 08160036 | 0.00000 | 0.510837 | 222.007 |