| Red | Green | Blue | |
| z | 17.64 | ||
| znorm | Inf | ||
| sky | -Inf | -Inf | -Inf |
| S/N | 26.6 | 46.4 | 51.8 |
| S/N(c) | 0.0 | 0.0 | 0.0 |
| SN(E/C) |
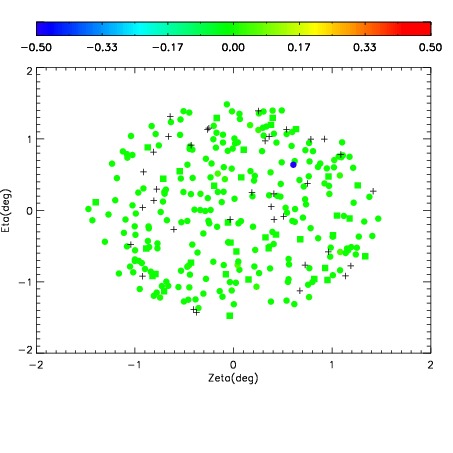
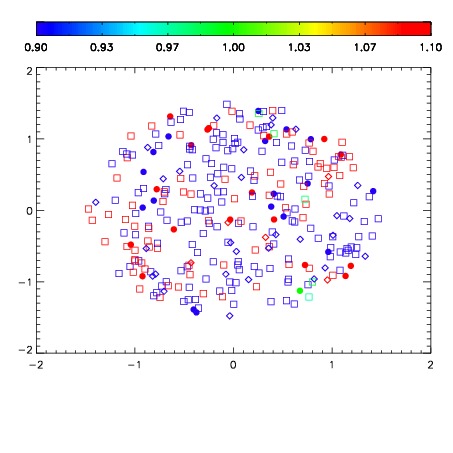
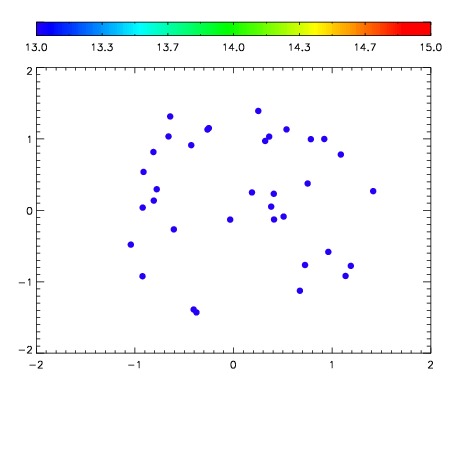

| Frame | Nreads | Zeropoints | Mag plots | Spatial mag deviation | Spatial sky 16325A emission deviations (filled: sky, open: star) | Spatial sky continuum emission | Spatial sky telluric CO2 absorption deviations (filled: H < 10) | |||||||||||||||||||||||
| 0 | 0 |
|
|
|
|
|
|
| IPAIR | NAME | SHIFT | NEWSHIFT | S/N | NAME | SHIFT | NEWSHIFT | S/N |
| 0 | 08420054 | 0.486395 | 0.00000 | 232.764 | 08420055 | -0.00181149 | 0.488207 | 232.557 |
| 1 | 08420050 | 0.485021 | 0.00137401 | 228.570 | 08420052 | -0.00253627 | 0.488931 | 227.446 |
| 2 | 08420053 | 0.486125 | 0.000270009 | 221.456 | 08420051 | 0.000276721 | 0.486118 | 226.823 |
| 3 | 08420049 | 0.485760 | 0.000634998 | 211.392 | 08420048 | 0.00000 | 0.486395 | 216.050 |