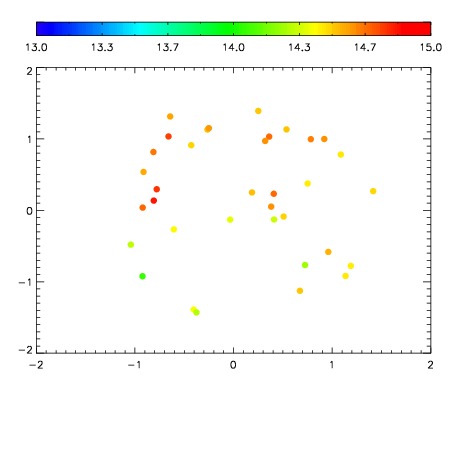
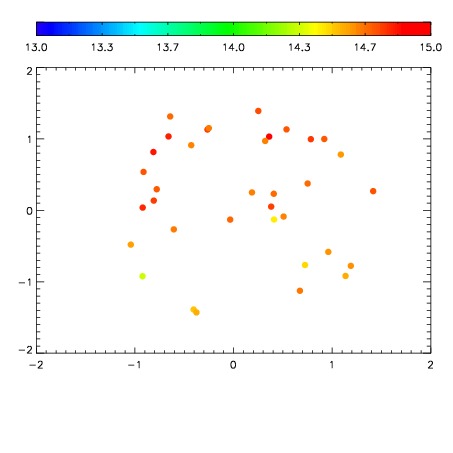
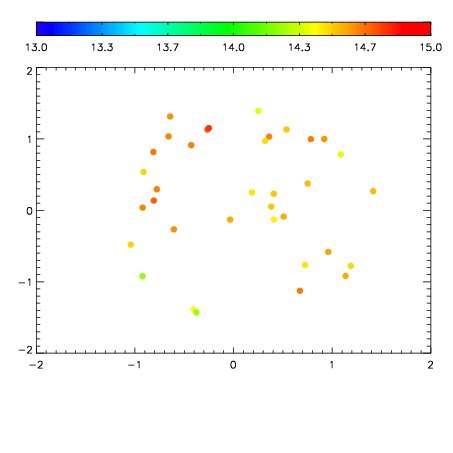
| Frame | Nreads | Zeropoints | Mag plots
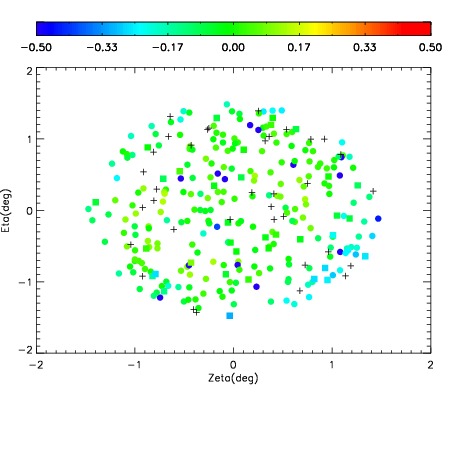
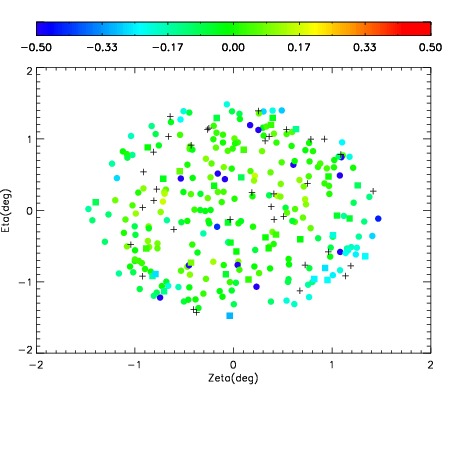
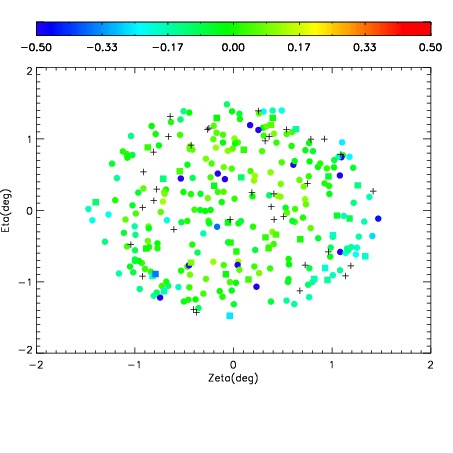
| Spatial mag deviation
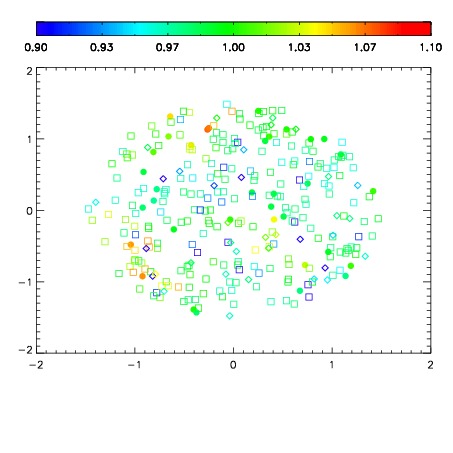
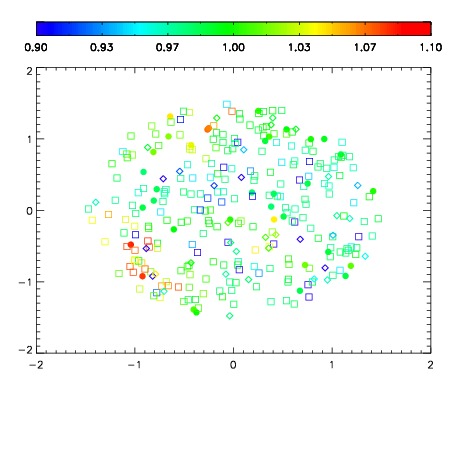
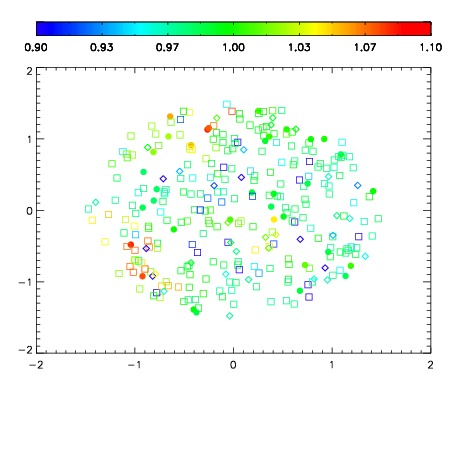
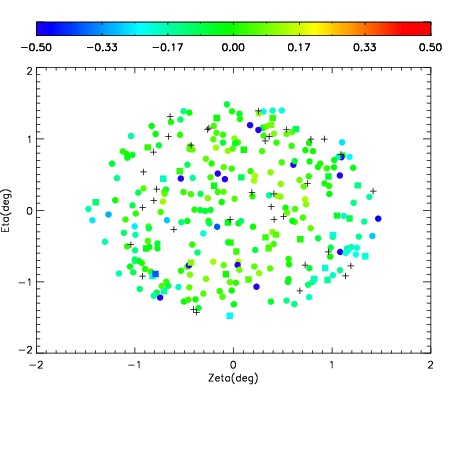
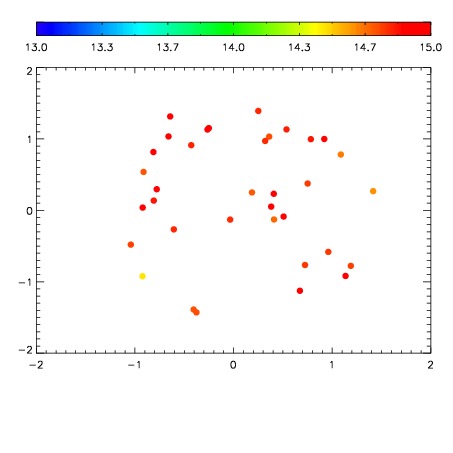
| Spatial sky 16325A emission deviations (filled: sky, open: star)
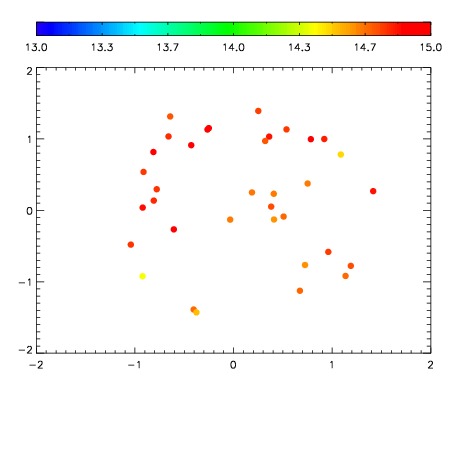
| Spatial sky continuum emission
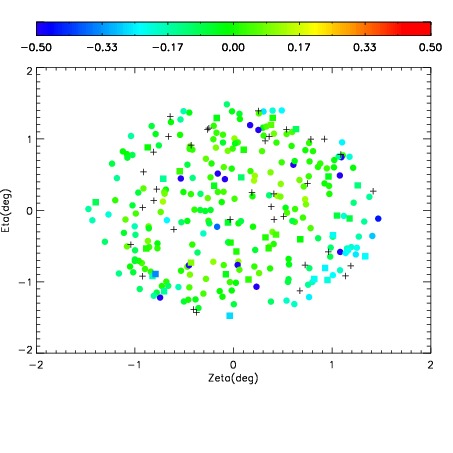
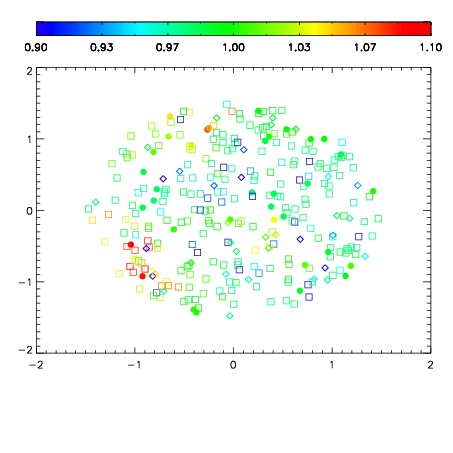
| Spatial sky telluric CO2 absorption deviations (filled: H < 10)
|
| 8470082
| 47
| | Red | Green | Blue
| | z | | 18.42
| | znorm | | 14.24
| | sky | 15.0 | 14.5 | 14.5
| | S/N | 9.6 | 17.0 | 18.3
| | S/N(c) | 8.0 | 15.4 | 16.8
| | SN(E/C) 0.42
|
| 
| 
| 
| 
| 
|
| 8470083
| 47
| | Red | Green | Blue
| | z | | 18.44
| | znorm | | 14.26
| | sky | 15.0 | 14.6 | 14.9
| | S/N | 9.5 | 17.2 | 18.6
| | S/N(c) | 7.8 | 15.6 | 17.1
| | SN(E/C) 0.40
|
| 
| 
| 
| 
| 
|
| 8470084
| 47
| | Red | Green | Blue
| | z | | 18.43
| | znorm | | 14.25
| | sky | 15.0 | 14.7 | 14.9
| | S/N | 9.8 | 17.2 | 18.6
| | S/N(c) | 8.2 | 15.7 | 16.9
| | SN(E/C) 0.40
|
| 
| 
| 
| 
| 
|
| 8470085
| 47
| | Red | Green | Blue
| | z | | 18.56
| | znorm | | 14.38
| | sky | 15.0 | 14.8 | 14.9
| | S/N | 10.7 | 18.7 | 19.9
| | S/N(c) | 9.1 | 16.9 | 18.5
| | SN(E/C) 0.40
|
| 
| 
| 
| 
| 
|
| 8470086
| 47
| | Red | Green | Blue
| | z | | 18.48
| | znorm | | 14.30
| | sky | 14.9 | 14.6 | 15.1
| | S/N | 10.0 | 17.5 | 19.1
| | S/N(c) | 8.6 | 16.0 | 17.6
| | SN(E/C) 0.42
|
| 
| 
| 
| 
| 
|
| 8470087
| 47
| | Red | Green | Blue
| | z | | 18.57
| | znorm | | 14.39
| | sky | 15.0 | 14.8 | 15.0
| | S/N | 10.7 | 18.6 | 20.0
| | S/N(c) | 9.0 | 17.0 | 18.6
| | SN(E/C) 0.40
|
| 
| 
| 
| 
| 
|
| 8470088
| 47
| | Red | Green | Blue
| | z | | 18.50
| | znorm | | 14.32
| | sky | 14.9 | 14.8 | 15.1
| | S/N | 10.2 | 17.8 | 19.0
| | S/N(c) | 8.5 | 16.3 | 17.5
| | SN(E/C) 0.40
|
| 
| 
| 
| 
| 
|
| 8470089
| 47
| | Red | Green | Blue
| | z | | 18.44
| | znorm | | 14.26
| | sky | 15.2 | 14.8 | 15.0
| | S/N | 9.4 | 17.3 | 18.4
| | S/N(c) | 8.1 | 15.9 | 16.9
| | SN(E/C) 0.42
|
| 
| 
| 
| 
| 
|