| Red | Green | Blue | |
| z | 17.64 | ||
| znorm | Inf | ||
| sky | -Inf | -Inf | -Inf |
| S/N | 16.9 | 31.9 | 34.8 |
| S/N(c) | 0.0 | 0.0 | 0.0 |
| SN(E/C) |
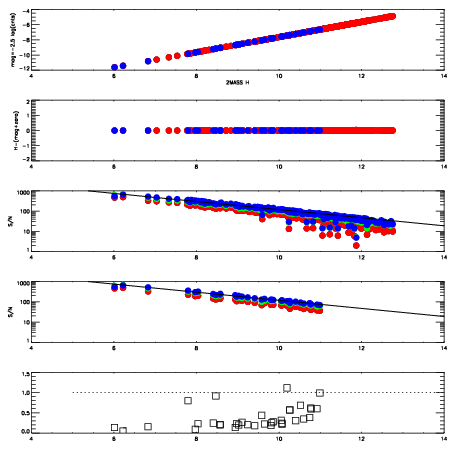
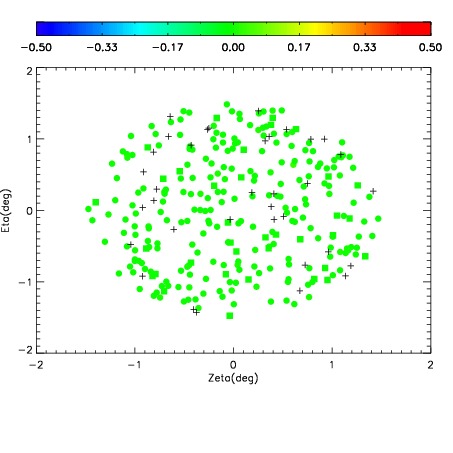
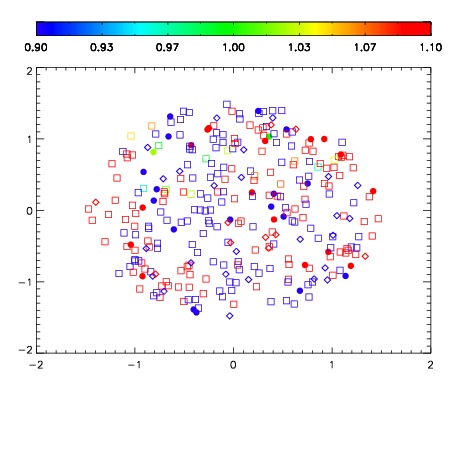
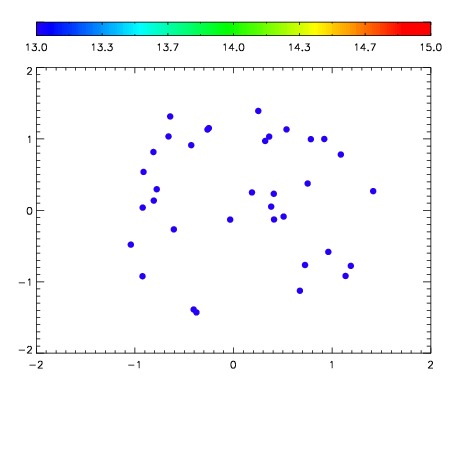

| Frame | Nreads | Zeropoints | Mag plots | Spatial mag deviation | Spatial sky 16325A emission deviations (filled: sky, open: star) | Spatial sky continuum emission | Spatial sky telluric CO2 absorption deviations (filled: H < 10) | |||||||||||||||||||||||
| 0 | 0 |
|
|
|
|
|
|
| IPAIR | NAME | SHIFT | NEWSHIFT | S/N | NAME | SHIFT | NEWSHIFT | S/N |
| 0 | 08470084 | 0.489923 | 0.00000 | 163.355 | 08470082 | 0.00000 | 0.489923 | 162.469 |
| 1 | 08470085 | 0.00317025 | 0.486753 | 174.271 | 08470087 | -0.430952 | 0.920875 | 176.256 |
| 2 | 08470088 | -0.427590 | 0.917513 | 171.908 | 08470086 | -0.887577 | 1.37750 | 168.687 |
| 3 | 08470083 | 0.487600 | 0.00232300 | 164.704 | 08470089 | -0.118943 | 0.608866 | 166.817 |