| Red | Green | Blue | |
| z | 17.64 | ||
| znorm | Inf | ||
| sky | -Inf | -Inf | -Inf |
| S/N | 24.0 | 41.7 | 47.7 |
| S/N(c) | 0.0 | 0.0 | 0.0 |
| SN(E/C) |

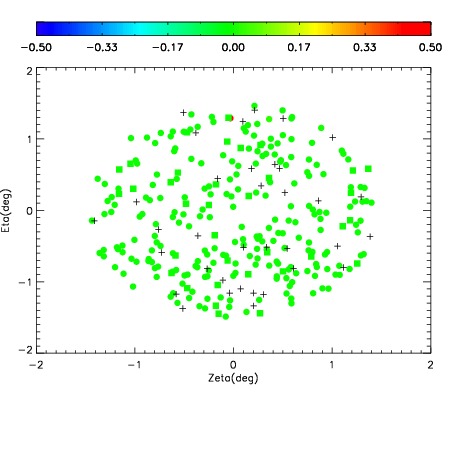
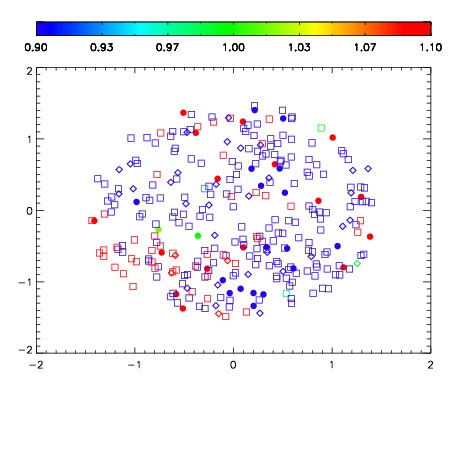
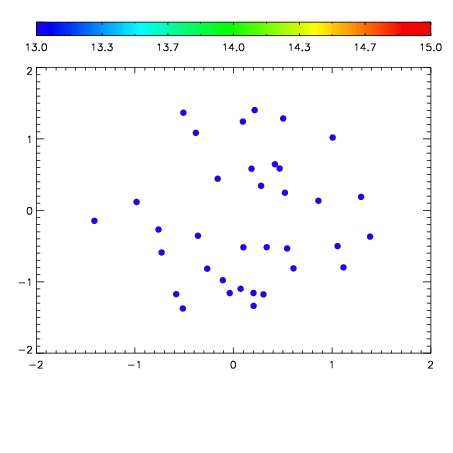

| Frame | Nreads | Zeropoints | Mag plots | Spatial mag deviation | Spatial sky 16325A emission deviations (filled: sky, open: star) | Spatial sky continuum emission | Spatial sky telluric CO2 absorption deviations (filled: H < 10) | |||||||||||||||||||||||
| 0 | 0 |
|
|
|
|
|
|
| IPAIR | NAME | SHIFT | NEWSHIFT | S/N | NAME | SHIFT | NEWSHIFT | S/N |
| 0 | 09080028 | 0.481980 | 0.00000 | 201.545 | 09080030 | 0.00373431 | 0.478246 | 196.573 |
| 1 | 09080027 | 0.481469 | 0.000510991 | 208.675 | 09080026 | 0.00000 | 0.481980 | 208.662 |
| 2 | 09080032 | 0.481272 | 0.000707984 | 207.895 | 09080033 | 0.00371311 | 0.478267 | 206.095 |
| 3 | 09080031 | 0.479366 | 0.00261399 | 205.459 | 09080029 | 0.00402647 | 0.477954 | 199.423 |