| Red | Green | Blue | |
| z | 17.64 | ||
| znorm | Inf | ||
| sky | -Inf | -Inf | -Inf |
| S/N | 19.5 | 35.6 | 40.9 |
| S/N(c) | 0.0 | 0.0 | 0.0 |
| SN(E/C) |
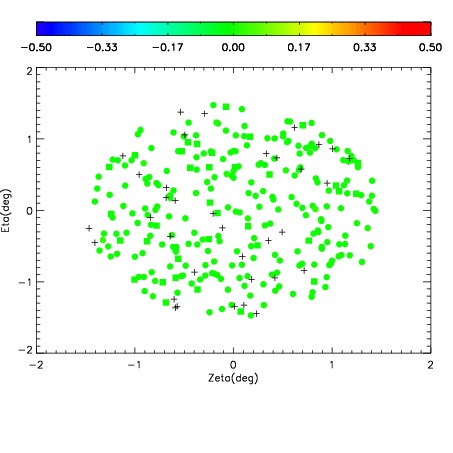
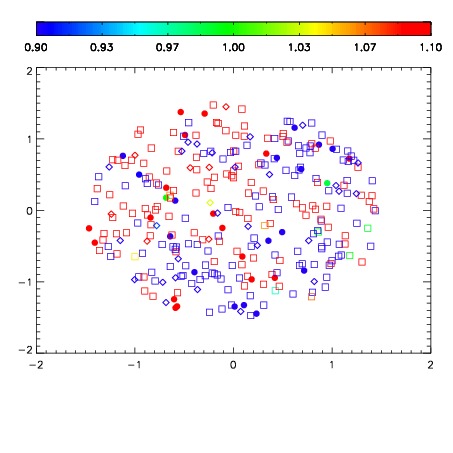
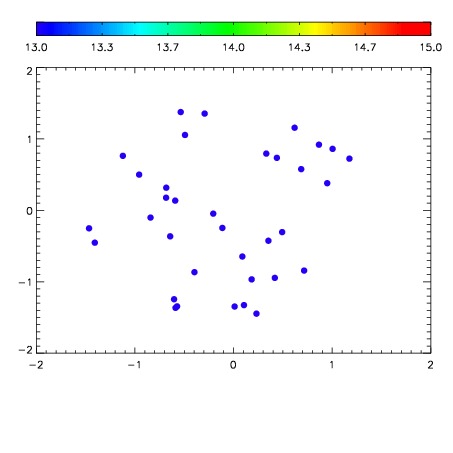

| Frame | Nreads | Zeropoints | Mag plots | Spatial mag deviation | Spatial sky 16325A emission deviations (filled: sky, open: star) | Spatial sky continuum emission | Spatial sky telluric CO2 absorption deviations (filled: H < 10) | |||||||||||||||||||||||
| 0 | 0 |
|
|
|
|
|
|
| IPAIR | NAME | SHIFT | NEWSHIFT | S/N | NAME | SHIFT | NEWSHIFT | S/N |
| 0 | 07830073 | 0.475521 | 0.00000 | 151.620 | 07830074 | 0.00104182 | 0.474479 | 154.909 |
| 1 | 07830072 | 0.474796 | 0.000725001 | 177.130 | 07830071 | 0.00000 | 0.475521 | 178.866 |
| 2 | 07830077 | 0.474520 | 0.00100100 | 172.299 | 07830078 | 0.00268722 | 0.472834 | 175.808 |
| 3 | 07830076 | 0.473312 | 0.00220901 | 170.594 | 07830075 | 0.000153772 | 0.475367 | 168.264 |