| Red | Green | Blue | |
| z | 17.64 | ||
| znorm | Inf | ||
| sky | -Inf | -Inf | -Inf |
| S/N | 27.7 | 48.3 | 52.8 |
| S/N(c) | 0.0 | 0.0 | 0.0 |
| SN(E/C) |

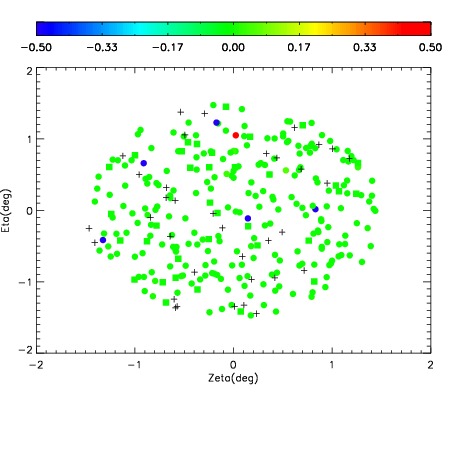
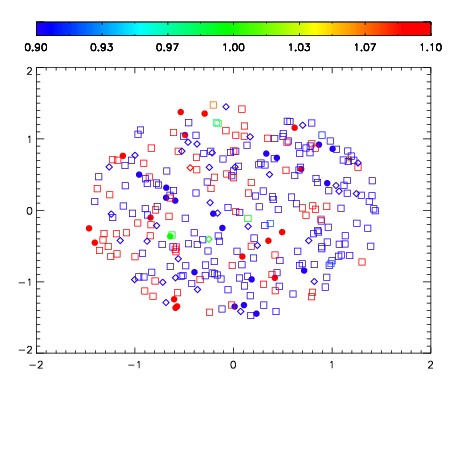


| Frame | Nreads | Zeropoints | Mag plots | Spatial mag deviation | Spatial sky 16325A emission deviations (filled: sky, open: star) | Spatial sky continuum emission | Spatial sky telluric CO2 absorption deviations (filled: H < 10) | |||||||||||||||||||||||
| 0 | 0 |
|
|
|
|
|
|
| IPAIR | NAME | SHIFT | NEWSHIFT | S/N | NAME | SHIFT | NEWSHIFT | S/N |
| 0 | 08150054 | 0.512514 | 0.00000 | 200.473 | 08150055 | -0.00591889 | 0.518433 | 202.386 |
| 1 | 08150050 | 0.511264 | 0.00124997 | 207.164 | 08150051 | -0.00526130 | 0.517775 | 208.022 |
| 2 | 08150049 | 0.498300 | 0.0142140 | 206.996 | 08150048 | 0.00000 | 0.512514 | 206.986 |
| 3 | 08150053 | 0.495486 | 0.0170280 | 198.257 | 08150052 | -0.00466292 | 0.517177 | 201.284 |