| Red | Green | Blue | |
| z | 17.64 | ||
| znorm | Inf | ||
| sky | -Inf | -Inf | -Inf |
| S/N | 25.1 | 41.8 | 50.5 |
| S/N(c) | 0.0 | 0.0 | 0.0 |
| SN(E/C) |

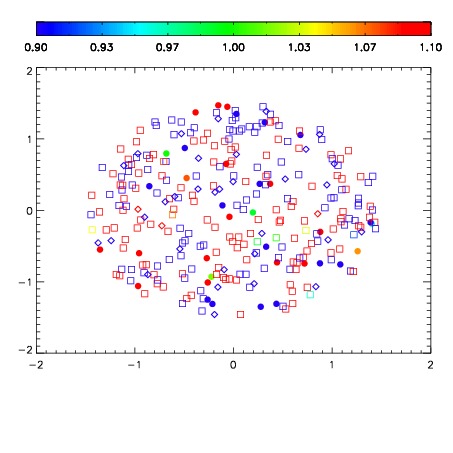


| Frame | Nreads | Zeropoints | Mag plots | Spatial mag deviation | Spatial sky 16325A emission deviations (filled: sky, open: star) | Spatial sky continuum emission | Spatial sky telluric CO2 absorption deviations (filled: H < 10) | |||||||||||||||||||||||
| 0 | 0 |
|
|
|
|
|
|
| IPAIR | NAME | SHIFT | NEWSHIFT | S/N | NAME | SHIFT | NEWSHIFT | S/N |
| 0 | 08140072 | 0.508913 | 0.00000 | 205.886 | 08140070 | 0.00000 | 0.508913 | 212.013 |
| 1 | 08140075 | 0.507265 | 0.00164801 | 212.984 | 08140073 | -0.00124865 | 0.510162 | 218.218 |
| 2 | 08140076 | 0.508346 | 0.000566959 | 211.030 | 08140074 | -0.00268499 | 0.511598 | 214.829 |
| 3 | 08140071 | 0.507355 | 0.00155801 | 201.241 | 08140077 | 0.000713334 | 0.508200 | 202.881 |