| Red | Green | Blue | |
| z | 17.64 | ||
| znorm | Inf | ||
| sky | -Inf | -Inf | -Inf |
| S/N | 24.1 | 43.2 | 46.3 |
| S/N(c) | 0.0 | 0.0 | 0.0 |
| SN(E/C) |

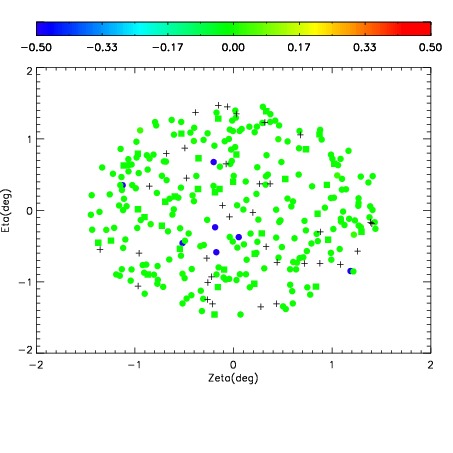
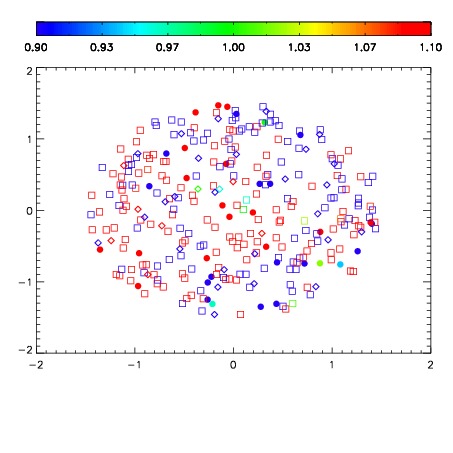
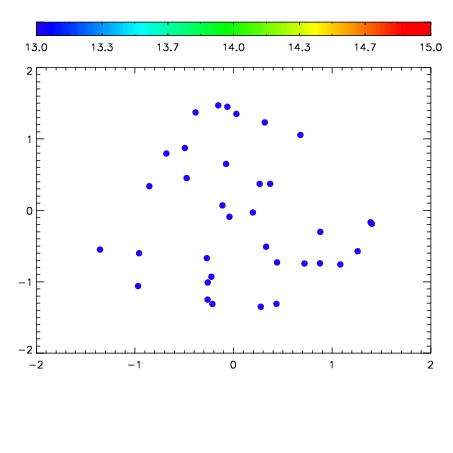

| Frame | Nreads | Zeropoints | Mag plots | Spatial mag deviation | Spatial sky 16325A emission deviations (filled: sky, open: star) | Spatial sky continuum emission | Spatial sky telluric CO2 absorption deviations (filled: H < 10) | |||||||||||||||||||||||
| 0 | 0 |
|
|
|
|
|
|
| IPAIR | NAME | SHIFT | NEWSHIFT | S/N | NAME | SHIFT | NEWSHIFT | S/N |
| 0 | 08210028 | 0.508324 | 0.00000 | 224.926 | 08210029 | -0.00706802 | 0.515392 | 221.234 |
| 1 | 08210023 | 0.499668 | 0.00865602 | 227.195 | 08210022 | 0.00000 | 0.508324 | 226.818 |
| 2 | 08210024 | 0.507037 | 0.00128704 | 218.250 | 08210025 | -0.00624629 | 0.514570 | 208.464 |
| 3 | 08210027 | 0.507721 | 0.000603020 | 214.595 | 08210026 | -0.00731402 | 0.515638 | 186.678 |