| Red | Green | Blue | |
| z | 17.64 | ||
| znorm | Inf | ||
| sky | -Inf | -Inf | -Inf |
| S/N | 26.7 | 45.4 | 50.6 |
| S/N(c) | 0.0 | 0.0 | 0.0 |
| SN(E/C) |

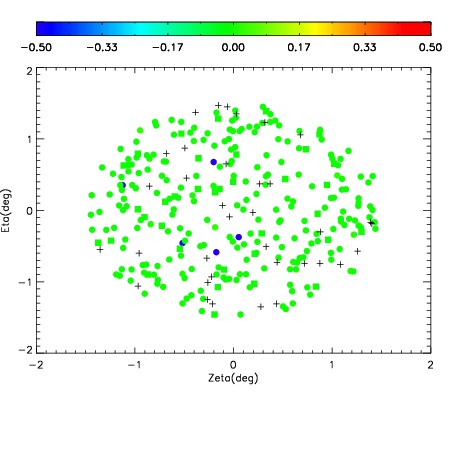
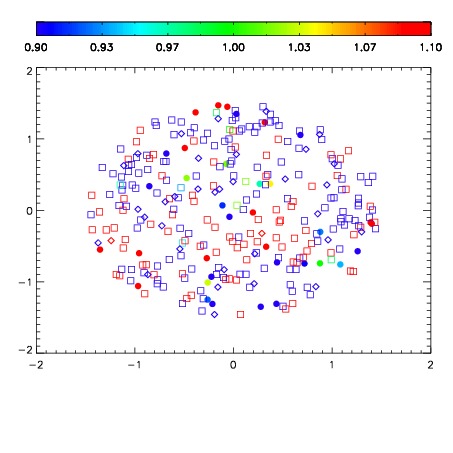
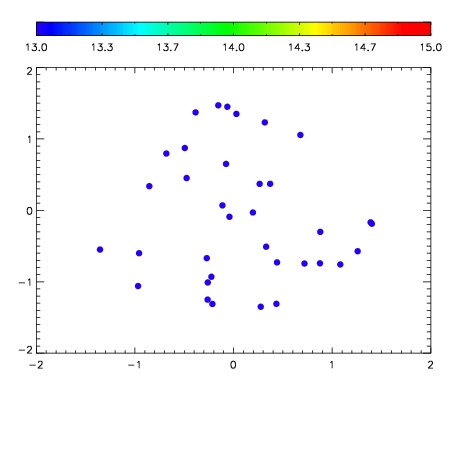

| Frame | Nreads | Zeropoints | Mag plots | Spatial mag deviation | Spatial sky 16325A emission deviations (filled: sky, open: star) | Spatial sky continuum emission | Spatial sky telluric CO2 absorption deviations (filled: H < 10) | |||||||||||||||||||||||
| 0 | 0 |
|
|
|
|
|
|
| IPAIR | NAME | SHIFT | NEWSHIFT | S/N | NAME | SHIFT | NEWSHIFT | S/N |
| 0 | 08400050 | 0.506147 | 0.00000 | 223.243 | 08400052 | 0.00121785 | 0.504929 | 220.002 |
| 1 | 08400053 | 0.504941 | 0.00120604 | 220.813 | 08400048 | 0.00000 | 0.506147 | 217.986 |
| 2 | 08400049 | 0.505090 | 0.00105703 | 219.977 | 08400051 | 0.00316507 | 0.502982 | 214.947 |
| 3 | 08400054 | 0.506024 | 0.000123024 | 215.671 | 08400055 | 0.00104396 | 0.505103 | 214.412 |