| Red | Green | Blue | |
| z | 17.64 | ||
| znorm | Inf | ||
| sky | -Inf | -Inf | -Inf |
| S/N | 23.3 | 41.3 | 47.2 |
| S/N(c) | 0.0 | 0.0 | 0.0 |
| SN(E/C) |


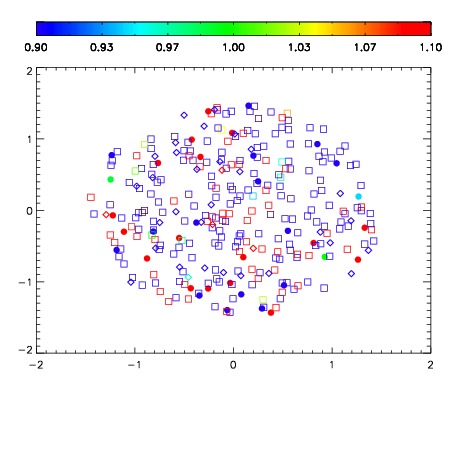


| Frame | Nreads | Zeropoints | Mag plots | Spatial mag deviation | Spatial sky 16325A emission deviations (filled: sky, open: star) | Spatial sky continuum emission | Spatial sky telluric CO2 absorption deviations (filled: H < 10) | |||||||||||||||||||||||
| 0 | 0 |
|
|
|
|
|
|
| IPAIR | NAME | SHIFT | NEWSHIFT | S/N | NAME | SHIFT | NEWSHIFT | S/N |
| 0 | 08160049 | 0.506140 | 0.00000 | 207.223 | 08160050 | -0.00326129 | 0.509401 | 204.761 |
| 1 | 08160053 | 0.503591 | 0.00254899 | 219.930 | 08160054 | -0.00218700 | 0.508327 | 217.832 |
| 2 | 08160048 | 0.500757 | 0.00538301 | 208.334 | 08160051 | -0.00520923 | 0.511349 | 204.795 |
| 3 | 08160052 | 0.495291 | 0.0108490 | 199.015 | 08160047 | 0.00000 | 0.506140 | 203.417 |