| Frame | Nreads | Zeropoints | Mag plots
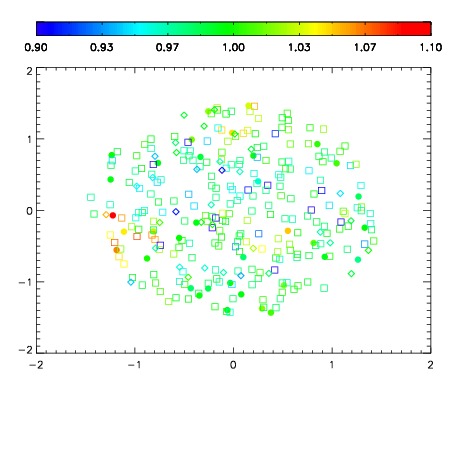
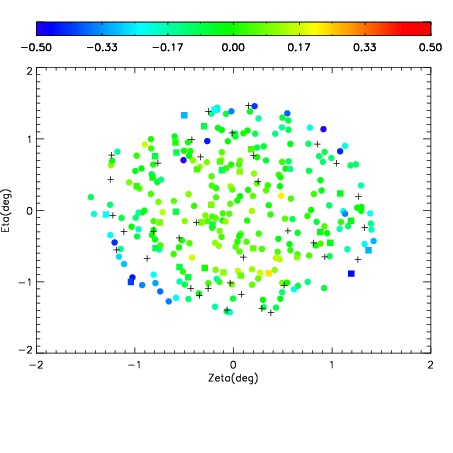
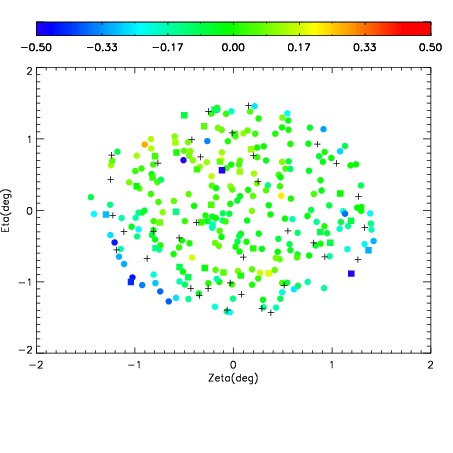
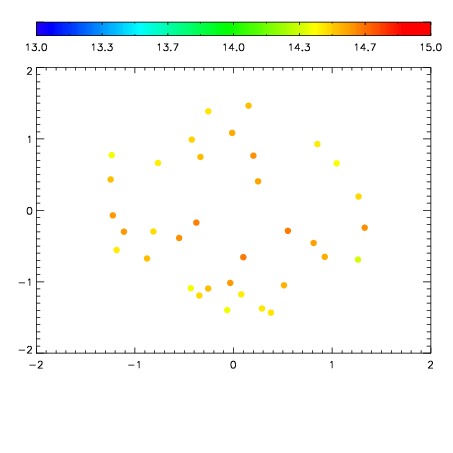
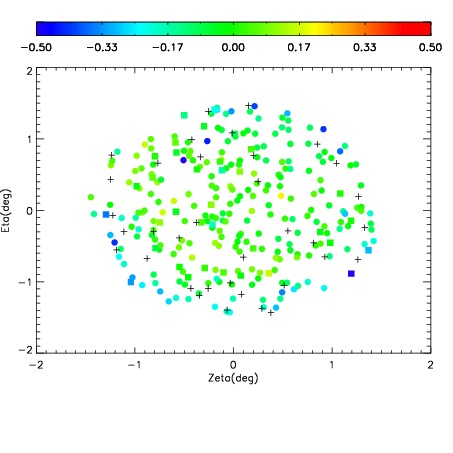
| Spatial mag deviation
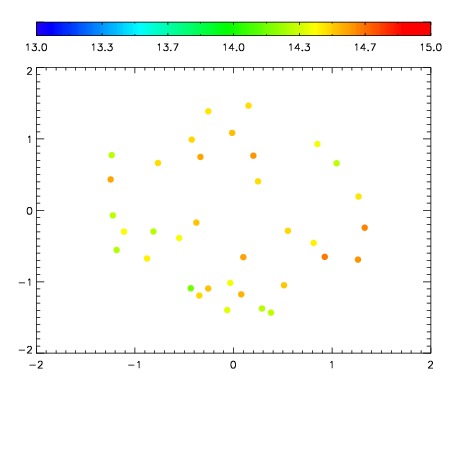
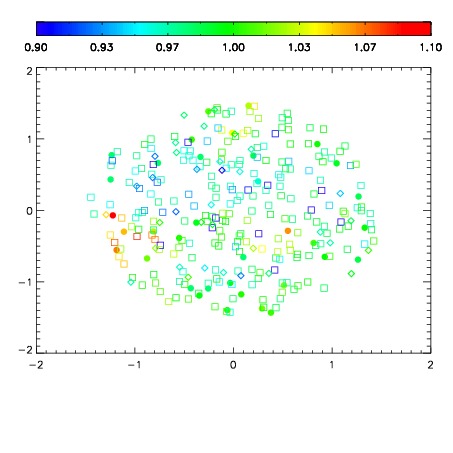
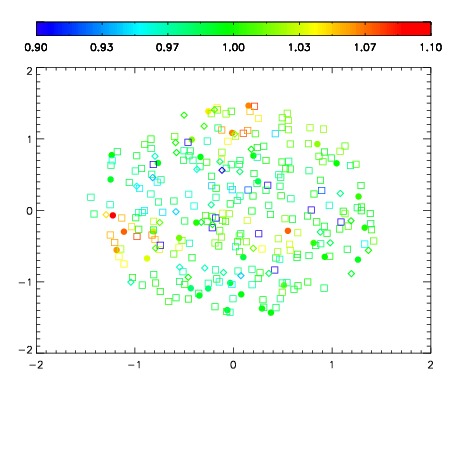
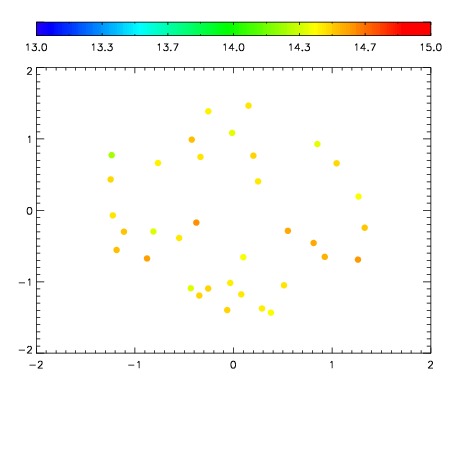
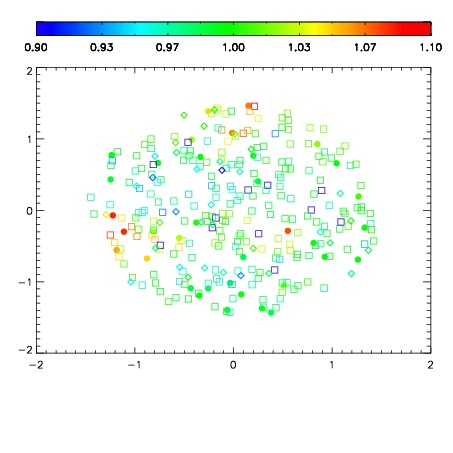
| Spatial sky 16325A emission deviations (filled: sky, open: star)
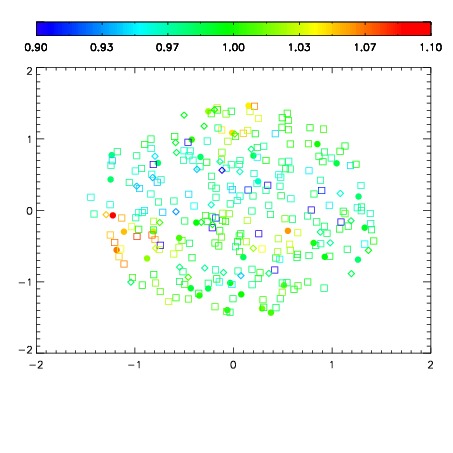
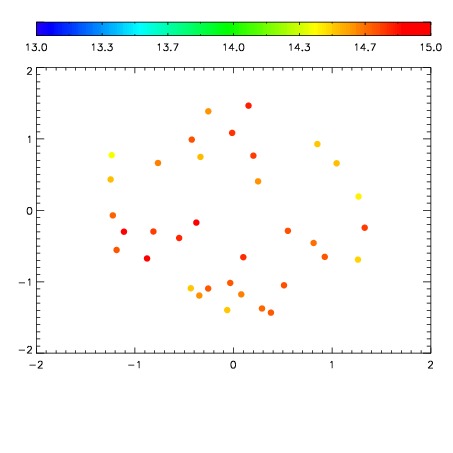
| Spatial sky continuum emission
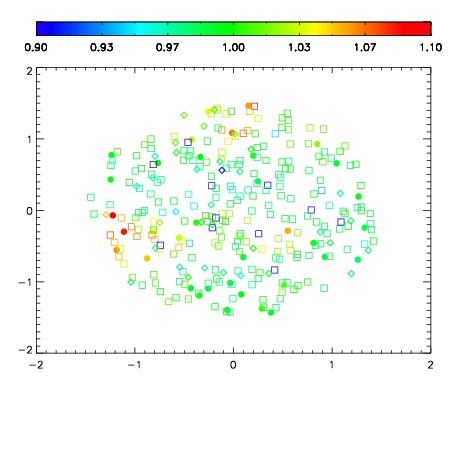
| Spatial sky telluric CO2 absorption deviations (filled: H < 10)
|
| 8220033
| 47
| | Red | Green | Blue
| | z | | 18.23
| | znorm | | 14.05
| | sky | 14.7 | 14.5 | 14.5
| | S/N | 8.5 | 15.2 | 16.5
| | S/N(c) | 7.2 | 14.1 | 15.6
| | SN(E/C) 0.70
|
| 
| 
| 
| 
| 
|
| 8220034
| 47
| | Red | Green | Blue
| | z | | 18.20
| | znorm | | 14.02
| | sky | 14.7 | 14.5 | 14.9
| | S/N | 8.4 | 15.3 | 16.9
| | S/N(c) | 7.1 | 14.1 | 15.8
| | SN(E/C) 0.65
|
| 
| 
| 
| 
| 
|
| 8220035
| 47
| | Red | Green | Blue
| | z | | 17.74
| | znorm | | 13.56
| | sky | 14.4 | 14.3 | 14.7
| | S/N | 5.8 | 11.7 | 12.4
| | S/N(c) | 4.9 | 10.5 | 11.4
| | SN(E/C) 0.77
|
| 
| 
| 
| 
| 
|
| 8220036
| 47
| | Red | Green | Blue
| | z | | 17.42
| | znorm | | 13.24
| | sky | 14.5 | 14.5 | 14.6
| | S/N | 4.1 | 9.0 | 9.5
| | S/N(c) | 3.6 | 8.0 | 8.9
| | SN(E/C) 0.82
|
| 
| 
| 
| 
| 
|
| 8220037
| 47
| | Red | Green | Blue
| | z | | 18.01
| | znorm | | 13.83
| | sky | 14.7 | 14.5 | 14.5
| | S/N | 7.0 | 13.8 | 14.5
| | S/N(c) | 6.0 | 12.2 | 13.8
| | SN(E/C) 0.67
|
| 
| 
| 
| 
| 
|
| 8220038
| 47
| | Red | Green | Blue
| | z | | 17.31
| | znorm | | 13.13
| | sky | 14.5 | 14.5 | 14.6
| | S/N | 3.9 | 8.4 | 8.9
| | S/N(c) | 3.3 | 7.5 | 8.0
| | SN(E/C) 0.83
|
| 
| 
| 
| 
| 
|
| 8220039
| 47
| | Red | Green | Blue
| | z | | 17.86
| | znorm | | 13.68
| | sky | 14.5 | 14.5 | 14.4
| | S/N | 6.1 | 12.2 | 12.7
| | S/N(c) | 5.1 | 10.7 | 12.2
| | SN(E/C) 0.81
|
| 
| 
| 
| 
| 
|
| 8220040
| 47
| | Red | Green | Blue
| | z | | 18.52
| | znorm | | 14.34
| | sky | 14.6 | 14.7 | 14.6
| | S/N | 10.4 | 18.6 | 19.8
| | S/N(c) | 8.8 | 16.8 | 18.5
| | SN(E/C) 0.64
|
| 
| 
| 
| 
| 
|