| Red | Green | Blue | |
| z | 17.64 | ||
| znorm | Inf | ||
| sky | -Inf | -Inf | -Inf |
| S/N | 10.9 | 21.5 | 23.5 |
| S/N(c) | 0.0 | 0.0 | 0.0 |
| SN(E/C) |
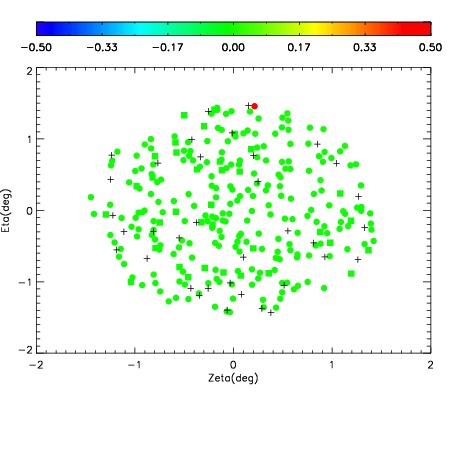
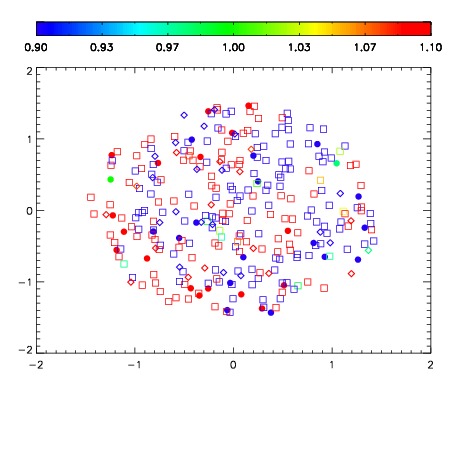
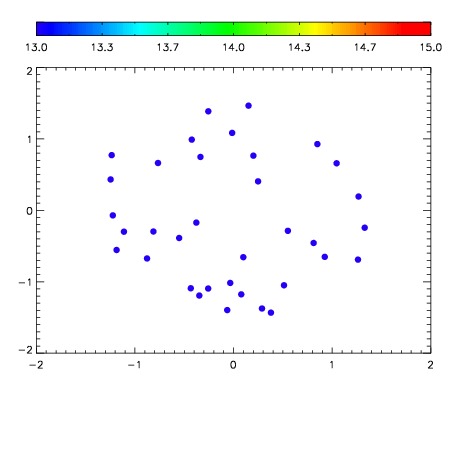

| Frame | Nreads | Zeropoints | Mag plots | Spatial mag deviation | Spatial sky 16325A emission deviations (filled: sky, open: star) | Spatial sky continuum emission | Spatial sky telluric CO2 absorption deviations (filled: H < 10) | |||||||||||||||||||||||
| 0 | 0 |
|
|
|
|
|
|
| IPAIR | NAME | SHIFT | NEWSHIFT | S/N | NAME | SHIFT | NEWSHIFT | S/N |
| 0 | 08220038 | 2.03479 | 0.00000 | 12.8814 | 08220037 | 1.50235 | 0.532440 | 20.6340 |
| 1 | 08220040 | 1.50853 | 0.526260 | 27.2409 | 08220033 | 0.00000 | 2.03479 | 23.7979 |
| 2 | 08220039 | 2.03476 | 3.00407e-05 | 17.9212 | 08220034 | 0.507533 | 1.52726 | 22.6751 |