| Red | Green | Blue | |
| z | 17.64 | ||
| znorm | Inf | ||
| sky | -Inf | -Inf | -Inf |
| S/N | 20.5 | 37.6 | 40.0 |
| S/N(c) | 0.0 | 0.0 | 0.0 |
| SN(E/C) |

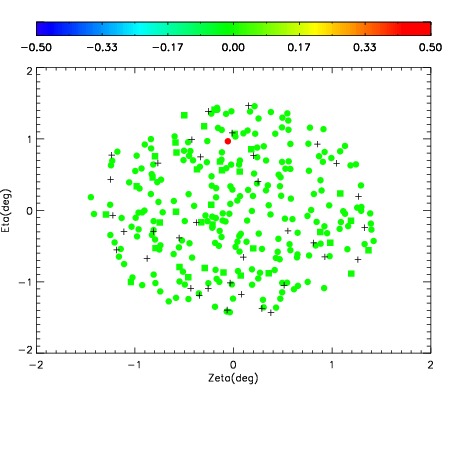
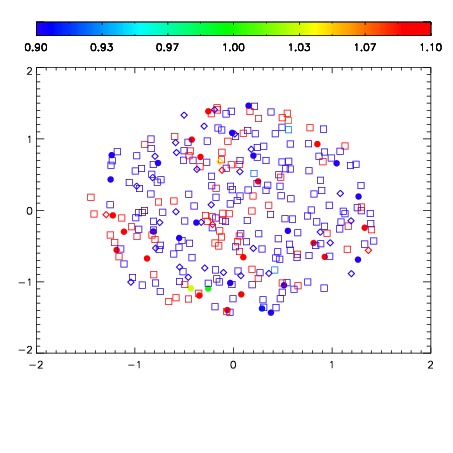
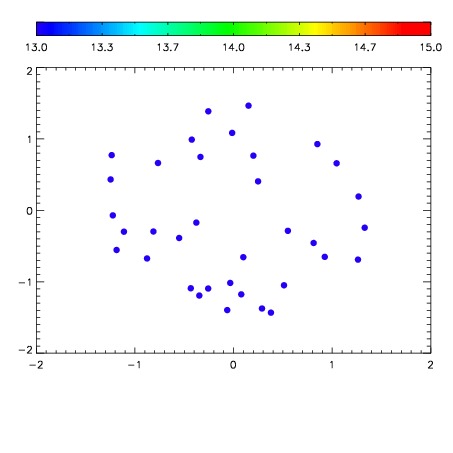

| Frame | Nreads | Zeropoints | Mag plots | Spatial mag deviation | Spatial sky 16325A emission deviations (filled: sky, open: star) | Spatial sky continuum emission | Spatial sky telluric CO2 absorption deviations (filled: H < 10) | |||||||||||||||||||||||
| 0 | 0 |
|
|
|
|
|
|
| IPAIR | NAME | SHIFT | NEWSHIFT | S/N | NAME | SHIFT | NEWSHIFT | S/N |
| 0 | 08710034 | 0.472979 | 0.00000 | 172.113 | 08710033 | 0.00000 | 0.472979 | 163.894 |
| 1 | 08710038 | 0.467523 | 0.00545600 | 203.330 | 08710037 | -0.000318234 | 0.473297 | 197.622 |
| 2 | 08710039 | 0.467566 | 0.00541300 | 190.896 | 08710036 | 0.000514491 | 0.472465 | 197.403 |
| 3 | 08710035 | 0.472881 | 9.80198e-05 | 188.835 | 08710040 | -0.00501865 | 0.477998 | 189.547 |