| Red | Green | Blue | |
| z | 17.64 | ||
| znorm | Inf | ||
| sky | -Inf | -Inf | -Inf |
| S/N | 20.4 | 35.5 | 39.8 |
| S/N(c) | 0.0 | 0.0 | 0.0 |
| SN(E/C) |
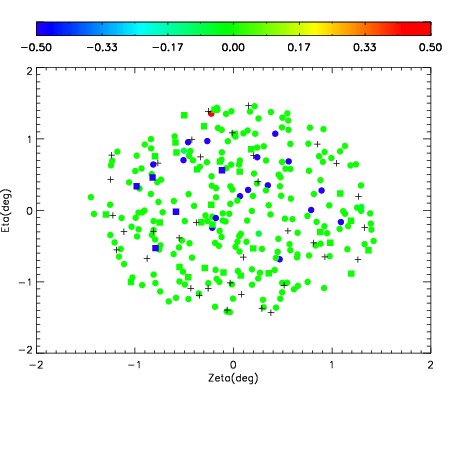
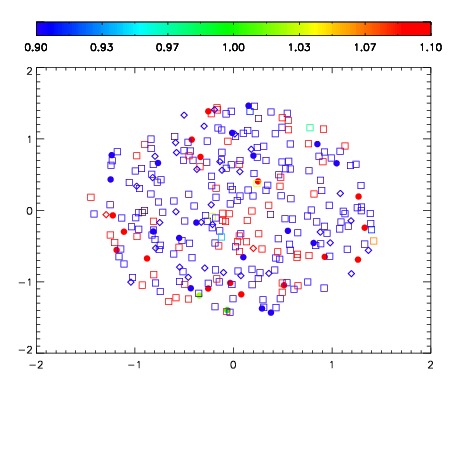


| Frame | Nreads | Zeropoints | Mag plots | Spatial mag deviation | Spatial sky 16325A emission deviations (filled: sky, open: star) | Spatial sky continuum emission | Spatial sky telluric CO2 absorption deviations (filled: H < 10) | |||||||||||||||||||||||
| 0 | 0 |
|
|
|
|
|
|
| IPAIR | NAME | SHIFT | NEWSHIFT | S/N | NAME | SHIFT | NEWSHIFT | S/N |
| 0 | 09070030 | 0.480897 | 0.00000 | 208.937 | 09070029 | 0.00416595 | 0.476731 | 218.128 |
| 1 | 09070031 | 0.480697 | 0.000200003 | 208.706 | 09070028 | 0.00414416 | 0.476753 | 213.611 |
| 2 | 09070026 | 0.286862 | 0.194035 | -6.42572e-09 | 09070025 | 0.00000 | 0.480897 | 212.582 |