| Red | Green | Blue | |
| z | 17.64 | ||
| znorm | Inf | ||
| sky | -NaN | -Inf | -Inf |
| S/N | 25.4 | 42.5 | 50.3 |
| S/N(c) | 0.0 | 0.0 | 0.0 |
| SN(E/C) |
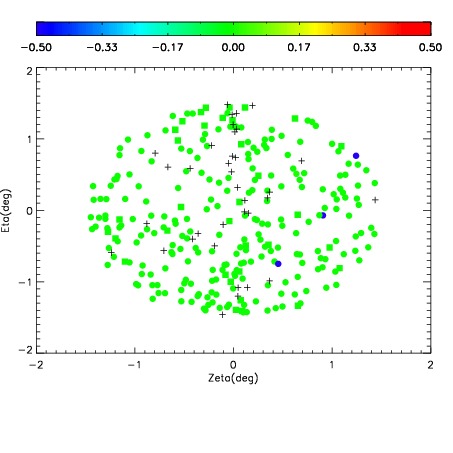
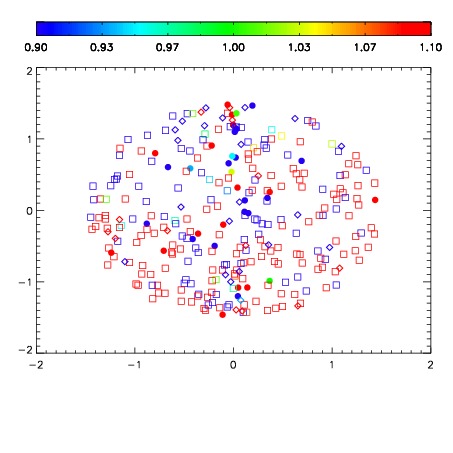
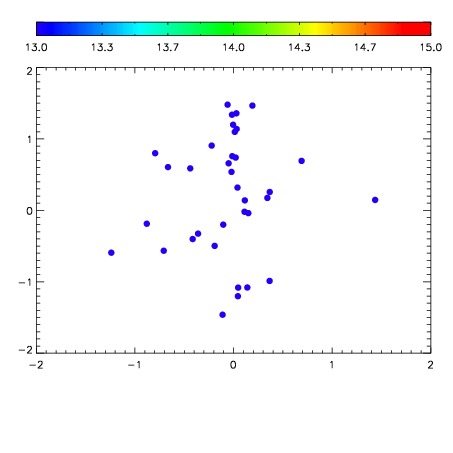

| Frame | Nreads | Zeropoints | Mag plots | Spatial mag deviation | Spatial sky 16325A emission deviations (filled: sky, open: star) | Spatial sky continuum emission | Spatial sky telluric CO2 absorption deviations (filled: H < 10) | |||||||||||||||||||||||
| 0 | 0 |
|
|
|
|
|
|
| IPAIR | NAME | SHIFT | NEWSHIFT | S/N | NAME | SHIFT | NEWSHIFT | S/N |
| 0 | 07890088 | 0.470441 | 0.00000 | 188.696 | 07890087 | 0.00111619 | 0.469325 | 194.388 |
| 1 | 07890085 | 0.469462 | 0.000979006 | 199.444 | 07890083 | 0.00000 | 0.470441 | 201.292 |
| 2 | 07890084 | 0.468744 | 0.00169700 | 198.589 | 07890086 | 0.00108143 | 0.469360 | 195.773 |
| 3 | 07890089 | 0.469871 | 0.000569999 | 179.151 | 07890090 | 0.00260678 | 0.467834 | 178.794 |