| Red | Green | Blue | |
| z | 17.64 | ||
| znorm | Inf | ||
| sky | -Inf | -Inf | -Inf |
| S/N | 19.9 | 36.5 | 41.6 |
| S/N(c) | 0.0 | 0.0 | 0.0 |
| SN(E/C) |
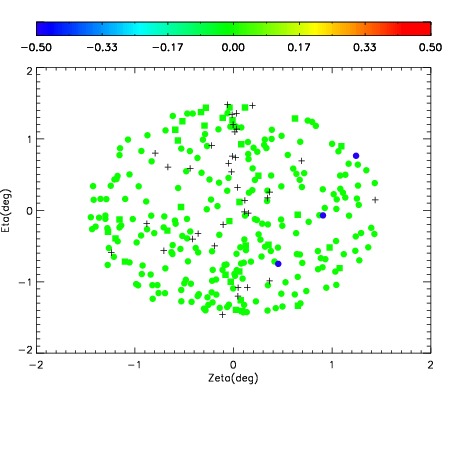
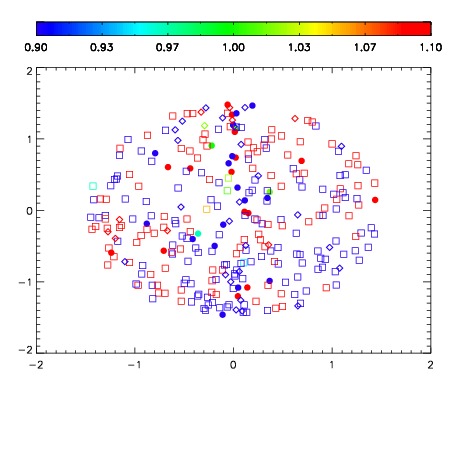
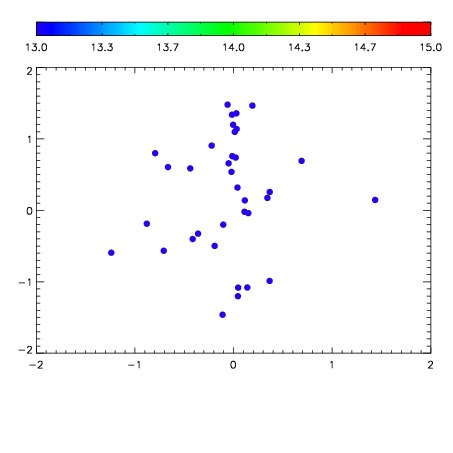

| Frame | Nreads | Zeropoints | Mag plots | Spatial mag deviation | Spatial sky 16325A emission deviations (filled: sky, open: star) | Spatial sky continuum emission | Spatial sky telluric CO2 absorption deviations (filled: H < 10) | |||||||||||||||||||||||
| 0 | 0 |
|
|
|
|
|
|
| IPAIR | NAME | SHIFT | NEWSHIFT | S/N | NAME | SHIFT | NEWSHIFT | S/N |
| 0 | 08440037 | 0.485647 | 0.00000 | 153.738 | 08440036 | 0.00000 | 0.485647 | 158.499 |
| 1 | 08440038 | 0.484733 | 0.000914007 | 145.914 | 08440040 | -0.00353616 | 0.489183 | 143.386 |
| 2 | 08440042 | 0.483894 | 0.00175300 | 143.576 | 08440043 | -0.00398386 | 0.489631 | 142.743 |
| 3 | 08440041 | 0.483325 | 0.00232199 | 143.126 | 08440039 | 0.00215740 | 0.483490 | 141.671 |