| Red | Green | Blue | |
| z | 17.64 | ||
| znorm | Inf | ||
| sky | -Inf | -Inf | -Inf |
| S/N | 19.2 | 33.2 | 38.8 |
| S/N(c) | 0.0 | 0.0 | 0.0 |
| SN(E/C) |
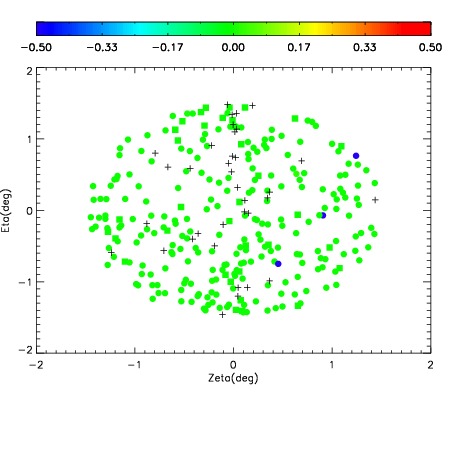

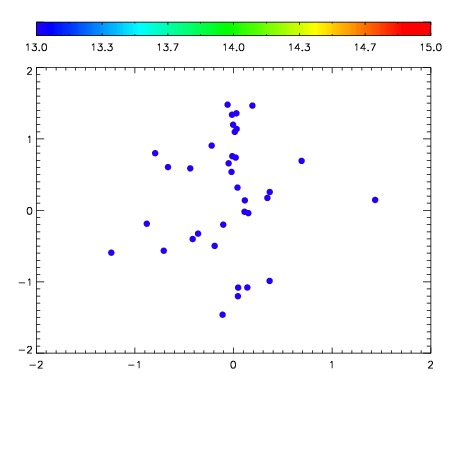

| Frame | Nreads | Zeropoints | Mag plots | Spatial mag deviation | Spatial sky 16325A emission deviations (filled: sky, open: star) | Spatial sky continuum emission | Spatial sky telluric CO2 absorption deviations (filled: H < 10) | |||||||||||||||||||||||
| 0 | 0 |
|
|
|
|
|
|
| IPAIR | NAME | SHIFT | NEWSHIFT | S/N | NAME | SHIFT | NEWSHIFT | S/N |
| 0 | 08480049 | 0.485867 | 0.00000 | 158.963 | 08480048 | 0.00000 | 0.485867 | 161.727 |
| 1 | 08480050 | 0.485467 | 0.000400007 | 158.047 | 08480051 | -0.000223023 | 0.486090 | 161.463 |
| 2 | 08480053 | 0.482571 | 0.00329599 | 145.812 | 08480052 | -0.00156192 | 0.487429 | 160.976 |