| Red | Green | Blue | |
| z | 17.64 | ||
| znorm | Inf | ||
| sky | -Inf | -Inf | -Inf |
| S/N | 24.1 | 43.9 | 48.0 |
| S/N(c) | 0.0 | 0.0 | 0.0 |
| SN(E/C) |
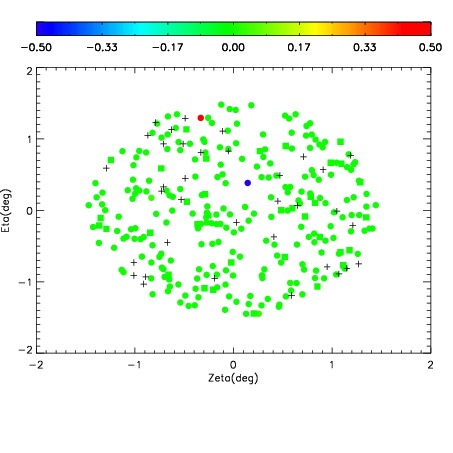
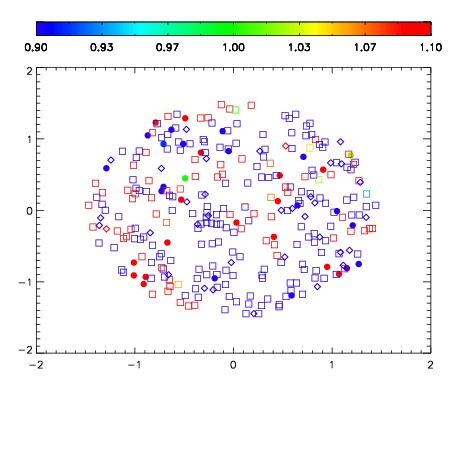
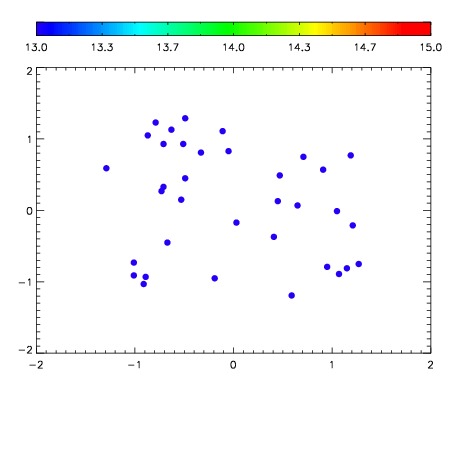

| Frame | Nreads | Zeropoints | Mag plots | Spatial mag deviation | Spatial sky 16325A emission deviations (filled: sky, open: star) | Spatial sky continuum emission | Spatial sky telluric CO2 absorption deviations (filled: H < 10) | |||||||||||||||||||||||
| 0 | 0 |
|
|
|
|
|
|
| IPAIR | NAME | SHIFT | NEWSHIFT | S/N | NAME | SHIFT | NEWSHIFT | S/N |
| 0 | 07870092 | 0.469318 | 0.00000 | 218.924 | 07870086 | 0.00000 | 0.469318 | 216.870 |
| 1 | 07870087 | 0.465863 | 0.00345501 | 224.320 | 07870090 | 0.000658426 | 0.468660 | 228.951 |
| 2 | 07870091 | 0.468014 | 0.00130400 | 224.279 | 07870093 | 0.00663911 | 0.462679 | 223.607 |
| 3 | 07870088 | 0.466008 | 0.00330999 | 224.202 | 07870089 | 0.00171448 | 0.467604 | 222.837 |