| Red | Green | Blue | |
| z | 17.64 | ||
| znorm | Inf | ||
| sky | -Inf | -Inf | -Inf |
| S/N | 24.9 | 45.4 | 49.7 |
| S/N(c) | 0.0 | 0.0 | 0.0 |
| SN(E/C) |
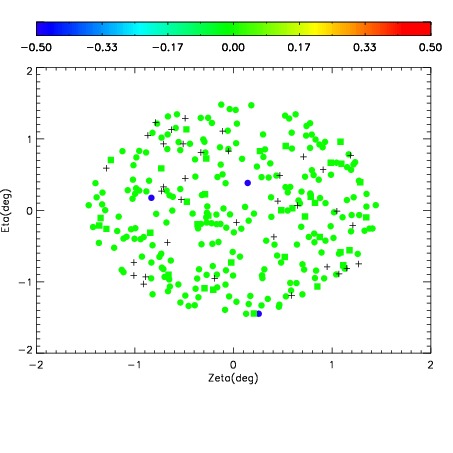
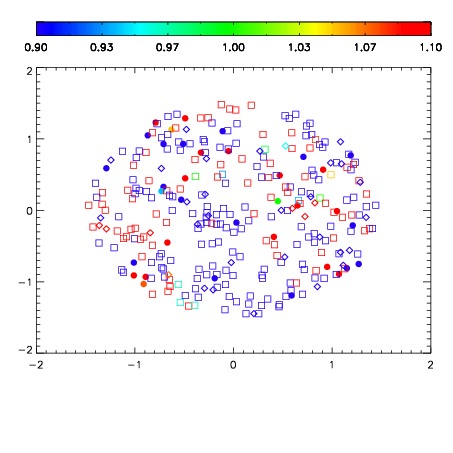
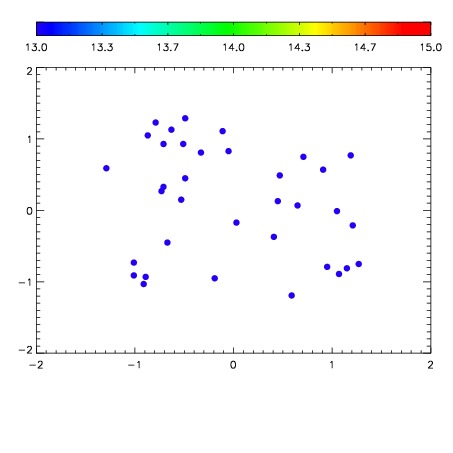

| Frame | Nreads | Zeropoints | Mag plots | Spatial mag deviation | Spatial sky 16325A emission deviations (filled: sky, open: star) | Spatial sky continuum emission | Spatial sky telluric CO2 absorption deviations (filled: H < 10) | |||||||||||||||||||||||
| 0 | 0 |
|
|
|
|
|
|
| IPAIR | NAME | SHIFT | NEWSHIFT | S/N | NAME | SHIFT | NEWSHIFT | S/N |
| 0 | 07910051 | 0.499893 | 0.00000 | 206.425 | 07910049 | 0.00000 | 0.499893 | 209.158 |
| 1 | 07910050 | 0.497333 | 0.00256002 | 214.999 | 07910053 | -0.00422024 | 0.504113 | 215.591 |
| 2 | 07910054 | 0.498269 | 0.00162402 | 214.004 | 07910056 | -0.00309010 | 0.502983 | 212.374 |
| 3 | 07910055 | 0.498907 | 0.000986010 | 211.833 | 07910052 | -0.00212266 | 0.502016 | 209.353 |