| Red | Green | Blue | |
| z | 17.64 | ||
| znorm | Inf | ||
| sky | -Inf | -Inf | -Inf |
| S/N | 22.2 | 39.9 | 46.2 |
| S/N(c) | 0.0 | 0.0 | 0.0 |
| SN(E/C) |
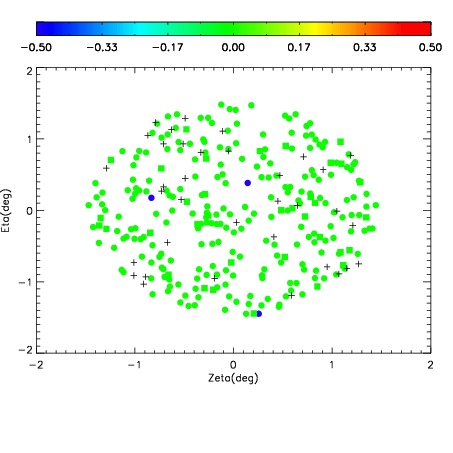
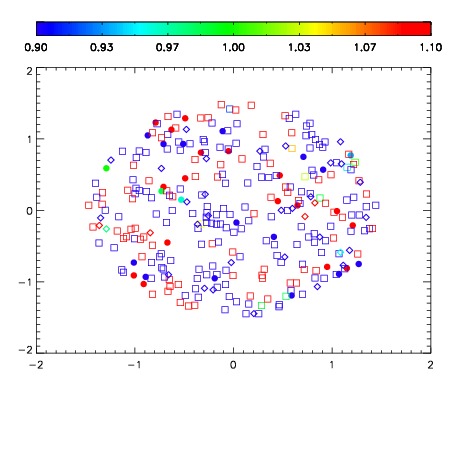
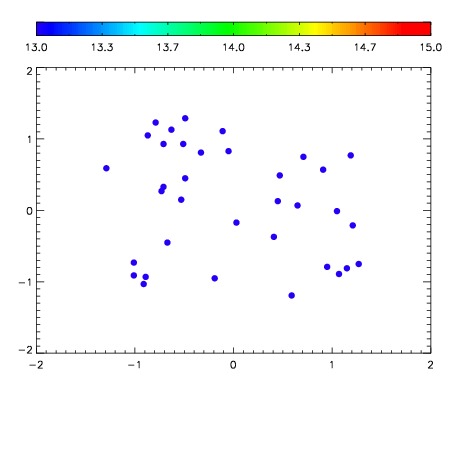

| Frame | Nreads | Zeropoints | Mag plots | Spatial mag deviation | Spatial sky 16325A emission deviations (filled: sky, open: star) | Spatial sky continuum emission | Spatial sky telluric CO2 absorption deviations (filled: H < 10) | |||||||||||||||||||||||
| 0 | 0 |
|
|
|
|
|
|
| IPAIR | NAME | SHIFT | NEWSHIFT | S/N | NAME | SHIFT | NEWSHIFT | S/N |
| 0 | 08140065 | 0.508377 | 0.00000 | 211.090 | 08140062 | -0.00223024 | 0.510607 | 211.741 |
| 1 | 08140064 | 0.503421 | 0.00495601 | 217.842 | 08140063 | -0.00426536 | 0.512642 | 216.481 |
| 2 | 08140060 | 0.505369 | 0.00300801 | 215.706 | 08140059 | 0.00000 | 0.508377 | 215.039 |
| 3 | 08140061 | 0.505296 | 0.00308102 | 214.889 | 08140066 | -0.00245098 | 0.510828 | 214.414 |