| Red | Green | Blue | |
| z | 17.64 | ||
| znorm | Inf | ||
| sky | -Inf | -NaN | -Inf |
| S/N | 20.0 | 35.5 | 41.8 |
| S/N(c) | 0.0 | 0.0 | 0.0 |
| SN(E/C) |

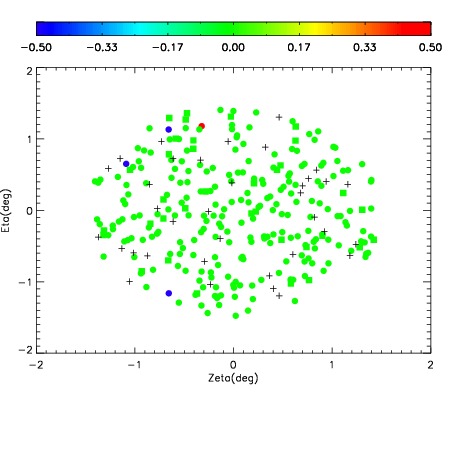
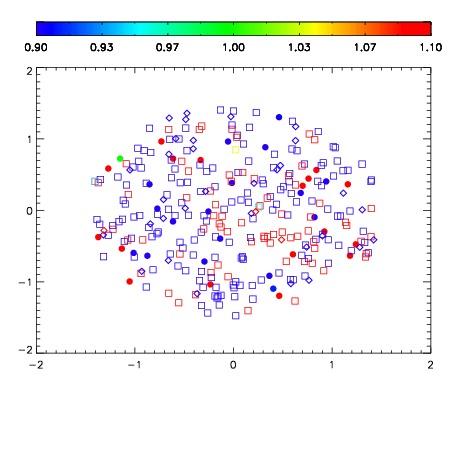
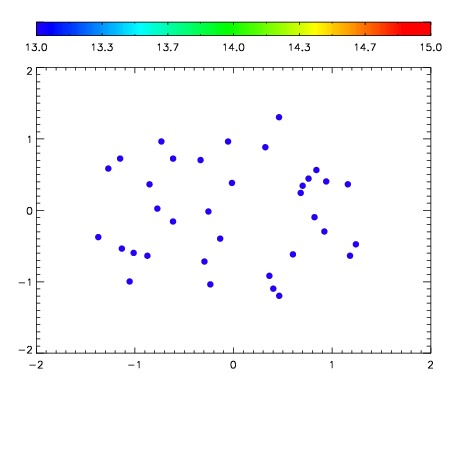

| Frame | Nreads | Zeropoints | Mag plots | Spatial mag deviation | Spatial sky 16325A emission deviations (filled: sky, open: star) | Spatial sky continuum emission | Spatial sky telluric CO2 absorption deviations (filled: H < 10) | |||||||||||||||||||||||
| 0 | 0 |
|
|
|
|
|
|
| IPAIR | NAME | SHIFT | NEWSHIFT | S/N | NAME | SHIFT | NEWSHIFT | S/N |
| 0 | 07620064 | 0.484929 | 0.00000 | 177.461 | 07620062 | 0.00280057 | 0.482128 | 192.847 |
| 1 | 07620061 | 0.483135 | 0.00179398 | 179.526 | 07620059 | 0.00000 | 0.484929 | 195.983 |
| 2 | 07620060 | 0.483308 | 0.00162101 | 170.313 | 07620063 | 0.00155388 | 0.483375 | 185.213 |