| Red | Green | Blue | |
| z | 17.64 | ||
| znorm | Inf | ||
| sky | -Inf | -NaN | -Inf |
| S/N | 26.1 | 46.5 | 51.5 |
| S/N(c) | 0.0 | 0.0 | 0.0 |
| SN(E/C) |
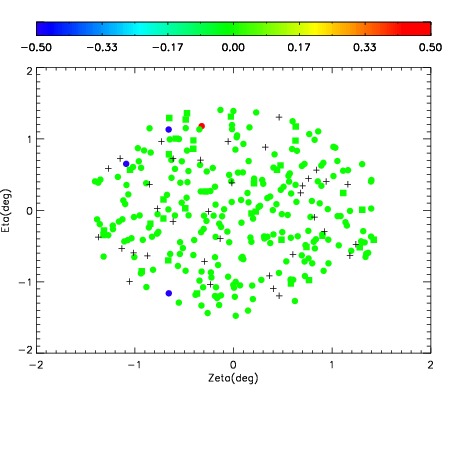
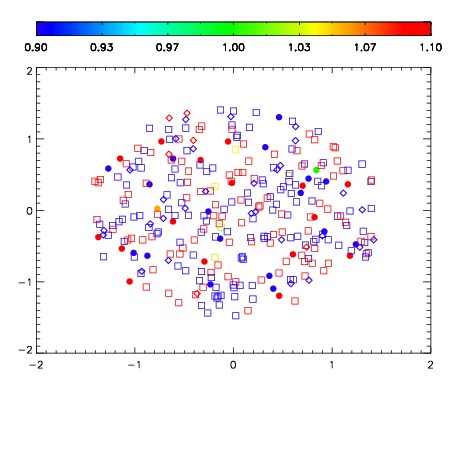
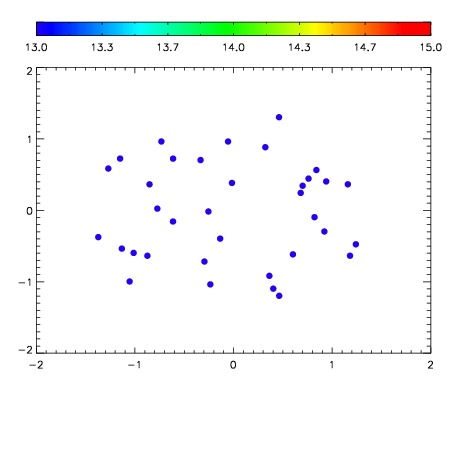

| Frame | Nreads | Zeropoints | Mag plots | Spatial mag deviation | Spatial sky 16325A emission deviations (filled: sky, open: star) | Spatial sky continuum emission | Spatial sky telluric CO2 absorption deviations (filled: H < 10) | |||||||||||||||||||||||
| 0 | 0 |
|
|
|
|
|
|
| IPAIR | NAME | SHIFT | NEWSHIFT | S/N | NAME | SHIFT | NEWSHIFT | S/N |
| 0 | 07850083 | 0.465108 | 0.00000 | 190.705 | 07850084 | 0.000593429 | 0.464515 | 192.800 |
| 1 | 07850086 | 0.463296 | 0.00181201 | 193.194 | 07850085 | -0.00187853 | 0.466987 | 195.698 |
| 2 | 07850087 | 0.463504 | 0.00160402 | 192.913 | 07850088 | -0.00271703 | 0.467825 | 195.332 |
| 3 | 07850082 | 0.464436 | 0.000672013 | 189.792 | 07850081 | 0.00000 | 0.465108 | 189.857 |