| Red | Green | Blue | |
| z | 17.64 | ||
| znorm | Inf | ||
| sky | -Inf | -Inf | -Inf |
| S/N | 21.6 | 38.2 | 44.1 |
| S/N(c) | 0.0 | 0.0 | 0.0 |
| SN(E/C) |
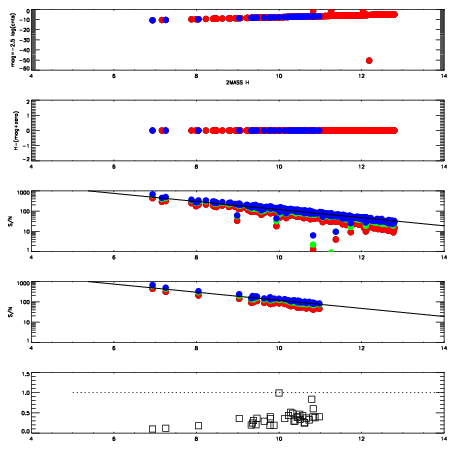
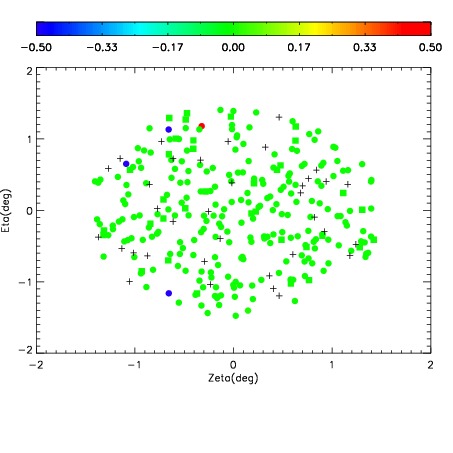
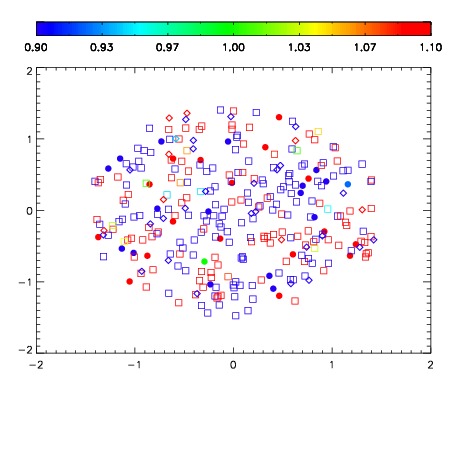
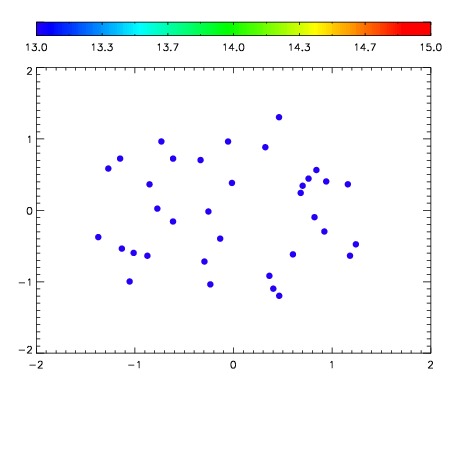

| Frame | Nreads | Zeropoints | Mag plots | Spatial mag deviation | Spatial sky 16325A emission deviations (filled: sky, open: star) | Spatial sky continuum emission | Spatial sky telluric CO2 absorption deviations (filled: H < 10) | |||||||||||||||||||||||
| 0 | 0 |
|
|
|
|
|
|
| IPAIR | NAME | SHIFT | NEWSHIFT | S/N | NAME | SHIFT | NEWSHIFT | S/N |
| 0 | 07900064 | 0.466955 | 0.00000 | 159.957 | 07900063 | -0.00266876 | 0.469624 | 163.978 |
| 1 | 07900060 | 0.463918 | 0.00303701 | 174.702 | 07900066 | -0.00135879 | 0.468314 | 181.403 |
| 2 | 07900065 | 0.466662 | 0.000293016 | 170.489 | 07900059 | 0.00000 | 0.466955 | 173.728 |
| 3 | 07900061 | 0.465014 | 0.00194100 | 165.407 | 07900062 | -0.00229676 | 0.469252 | 173.622 |