| Red | Green | Blue | |
| z | 17.64 | ||
| znorm | Inf | ||
| sky | -Inf | -Inf | -Inf |
| S/N | 24.6 | 46.0 | 49.6 |
| S/N(c) | 0.0 | 0.0 | 0.0 |
| SN(E/C) |
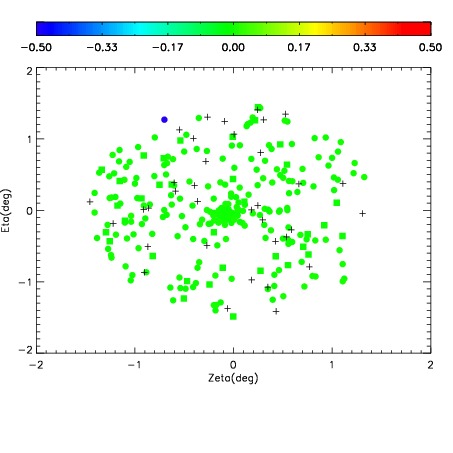
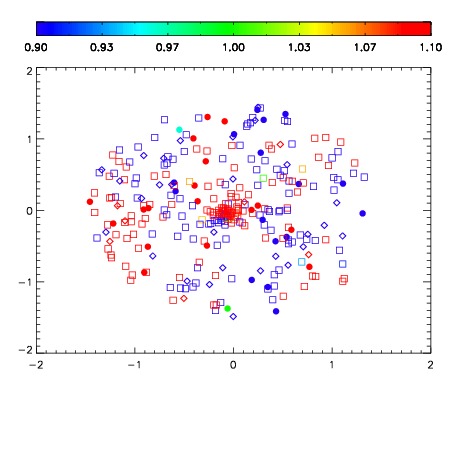
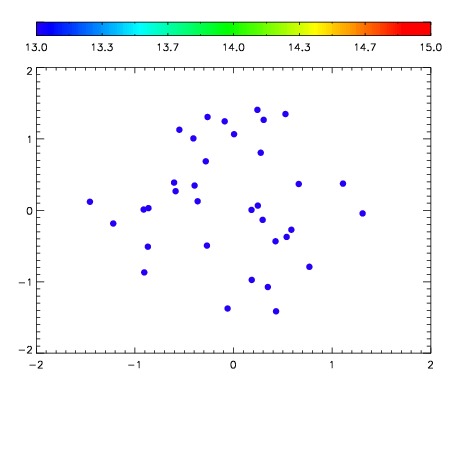

| Frame | Nreads | Zeropoints | Mag plots | Spatial mag deviation | Spatial sky 16325A emission deviations (filled: sky, open: star) | Spatial sky continuum emission | Spatial sky telluric CO2 absorption deviations (filled: H < 10) | |||||||||||||||||||||||
| 0 | 0 |
|
|
|
|
|
|
| IPAIR | NAME | SHIFT | NEWSHIFT | S/N | NAME | SHIFT | NEWSHIFT | S/N |
| 0 | 07910066 | 0.505251 | 0.00000 | 217.486 | 07910067 | 0.000871522 | 0.504379 | 216.053 |
| 1 | 07910065 | 0.501854 | 0.00339699 | 221.571 | 07910060 | 0.00000 | 0.505251 | 225.091 |
| 2 | 07910061 | 0.500641 | 0.00461000 | 219.723 | 07910064 | -0.000927977 | 0.506179 | 222.864 |
| 3 | 07910062 | 0.503933 | 0.00131798 | 215.961 | 07910063 | 9.53181e-05 | 0.505156 | 211.270 |