| Red | Green | Blue | |
| z | 17.64 | ||
| znorm | Inf | ||
| sky | -Inf | -Inf | -Inf |
| S/N | 23.0 | 41.8 | 44.3 |
| S/N(c) | 0.0 | 0.0 | 0.0 |
| SN(E/C) |

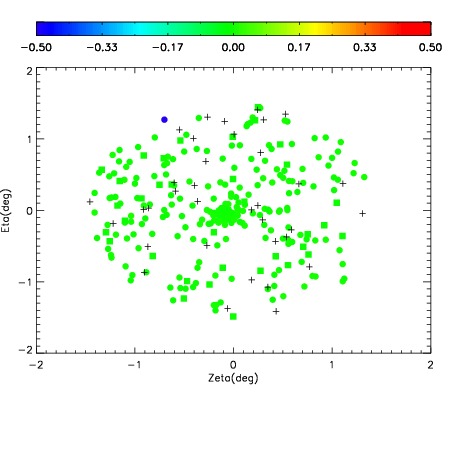
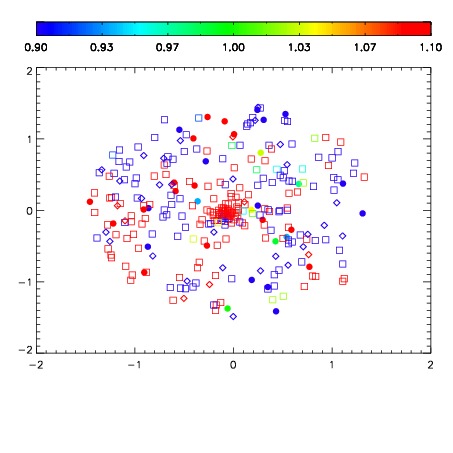
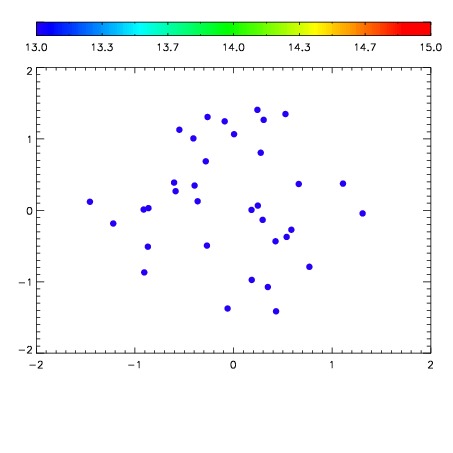

| Frame | Nreads | Zeropoints | Mag plots | Spatial mag deviation | Spatial sky 16325A emission deviations (filled: sky, open: star) | Spatial sky continuum emission | Spatial sky telluric CO2 absorption deviations (filled: H < 10) | |||||||||||||||||||||||
| 0 | 0 |
|
|
|
|
|
|
| IPAIR | NAME | SHIFT | NEWSHIFT | S/N | NAME | SHIFT | NEWSHIFT | S/N |
| 0 | 08140087 | 0.510604 | 0.00000 | 222.438 | 08140085 | -0.00261448 | 0.513219 | 214.554 |
| 1 | 08140086 | 0.505679 | 0.00492501 | 224.270 | 08140088 | -0.00340088 | 0.514005 | 224.693 |
| 2 | 08140082 | 0.505527 | 0.00507700 | 205.945 | 08140084 | -0.00255854 | 0.513163 | 204.683 |
| 3 | 08140083 | 0.508425 | 0.00217903 | 181.257 | 08140081 | 0.00000 | 0.510604 | 202.381 |