| Red | Green | Blue | |
| z | 17.64 | ||
| znorm | Inf | ||
| sky | -Inf | -Inf | -Inf |
| S/N | 27.7 | 48.4 | 53.0 |
| S/N(c) | 0.0 | 0.0 | 0.0 |
| SN(E/C) |
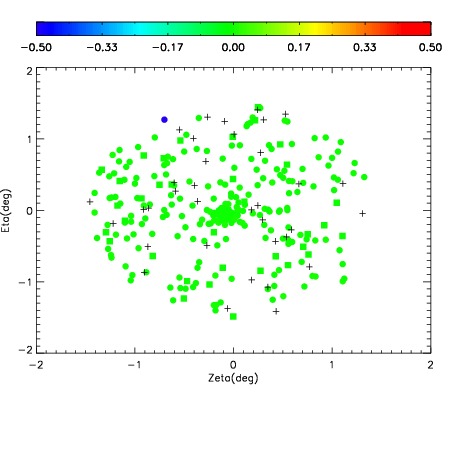
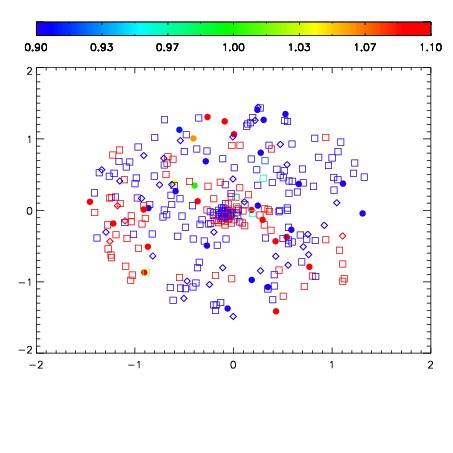
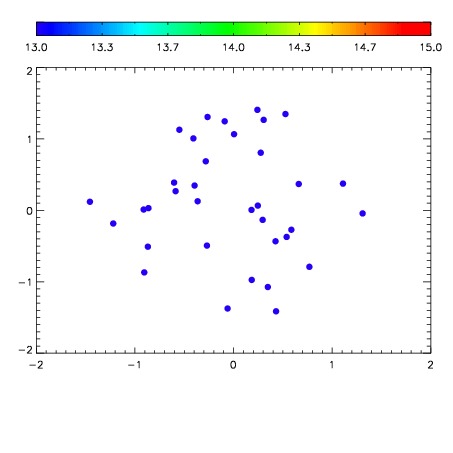

| Frame | Nreads | Zeropoints | Mag plots | Spatial mag deviation | Spatial sky 16325A emission deviations (filled: sky, open: star) | Spatial sky continuum emission | Spatial sky telluric CO2 absorption deviations (filled: H < 10) | |||||||||||||||||||||||
| 0 | 0 |
|
|
|
|
|
|
| IPAIR | NAME | SHIFT | NEWSHIFT | S/N | NAME | SHIFT | NEWSHIFT | S/N |
| 0 | 08210035 | 0.510230 | 0.00000 | 238.638 | 08210040 | -0.00199296 | 0.512223 | 238.034 |
| 1 | 08210039 | 0.508928 | 0.00130200 | 239.675 | 08210037 | -0.00256355 | 0.512794 | 239.741 |
| 2 | 08210038 | 0.510123 | 0.000106990 | 238.393 | 08210036 | -0.00100987 | 0.511240 | 237.239 |
| 3 | 08210034 | 0.510099 | 0.000131011 | 231.281 | 08210033 | 0.00000 | 0.510230 | 213.747 |