| Red | Green | Blue | |
| z | 17.64 | ||
| znorm | Inf | ||
| sky | -Inf | -Inf | -Inf |
| S/N | 25.2 | 45.0 | 51.3 |
| S/N(c) | 0.0 | 0.0 | 0.0 |
| SN(E/C) |

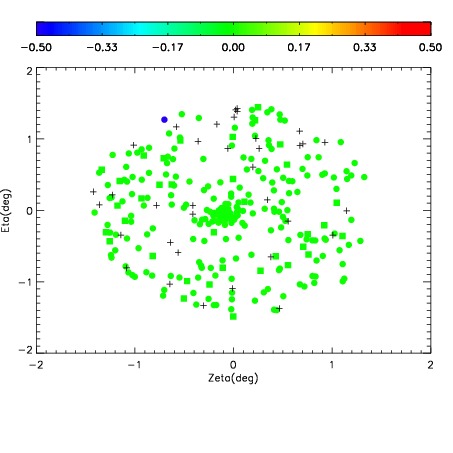
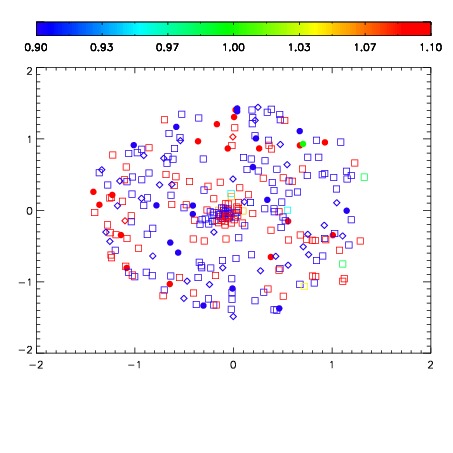
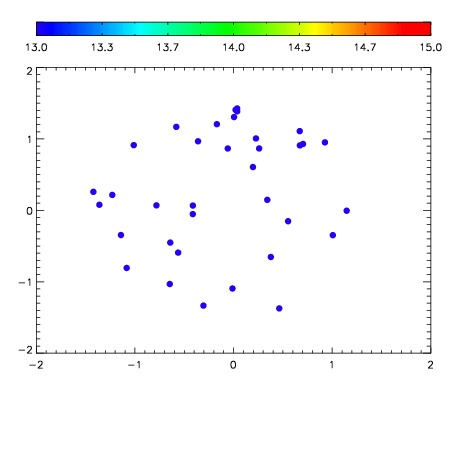

| Frame | Nreads | Zeropoints | Mag plots | Spatial mag deviation | Spatial sky 16325A emission deviations (filled: sky, open: star) | Spatial sky continuum emission | Spatial sky telluric CO2 absorption deviations (filled: H < 10) | |||||||||||||||||||||||
| 0 | 0 |
|
|
|
|
|
|
| IPAIR | NAME | SHIFT | NEWSHIFT | S/N | NAME | SHIFT | NEWSHIFT | S/N |
| 0 | 08150065 | 0.516325 | 0.00000 | 165.717 | 08150063 | -0.00417054 | 0.520496 | 162.493 |
| 1 | 08150060 | 0.503394 | 0.0129310 | 166.199 | 08150059 | 0.00000 | 0.516325 | 165.410 |
| 2 | 08150064 | 0.502777 | 0.0135480 | 162.512 | 08150066 | -0.00360461 | 0.519930 | 161.603 |
| 3 | 08150061 | 0.515724 | 0.000600994 | 157.800 | 08150062 | -0.000894386 | 0.517219 | 157.483 |