| Red | Green | Blue | |
| z | 17.64 | ||
| znorm | Inf | ||
| sky | -Inf | -Inf | -Inf |
| S/N | 25.6 | 43.5 | 51.6 |
| S/N(c) | 0.0 | 0.0 | 0.0 |
| SN(E/C) |
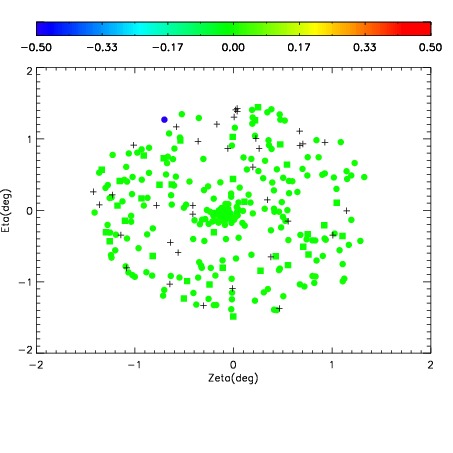

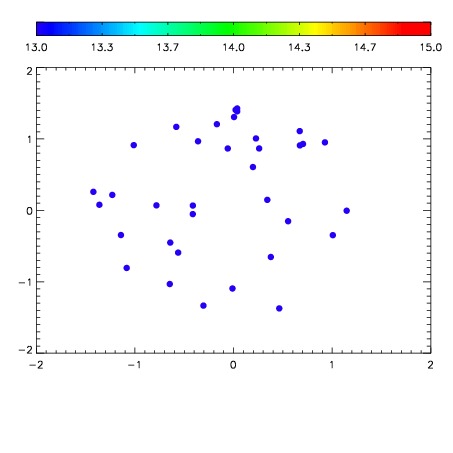

| Frame | Nreads | Zeropoints | Mag plots | Spatial mag deviation | Spatial sky 16325A emission deviations (filled: sky, open: star) | Spatial sky continuum emission | Spatial sky telluric CO2 absorption deviations (filled: H < 10) | |||||||||||||||||||||||
| 0 | 0 |
|
|
|
|
|
|
| IPAIR | NAME | SHIFT | NEWSHIFT | S/N | NAME | SHIFT | NEWSHIFT | S/N |
| 0 | 08220028 | 0.507946 | 0.00000 | 133.738 | 08220029 | 0.000565182 | 0.507381 | 137.263 |
| 1 | 08220027 | 0.506676 | 0.00127000 | 152.446 | 08220026 | -0.000463026 | 0.508409 | 145.764 |
| 2 | 08220024 | 0.507613 | 0.000333011 | 140.958 | 08220025 | -0.00151992 | 0.509466 | 144.964 |
| 3 | 08220023 | 0.507637 | 0.000308990 | 136.229 | 08220022 | 0.00000 | 0.507946 | 138.874 |