| Red | Green | Blue | |
| z | 17.64 | ||
| znorm | Inf | ||
| sky | -Inf | -Inf | -Inf |
| S/N | 26.2 | 44.9 | 54.3 |
| S/N(c) | 0.0 | 0.0 | 0.0 |
| SN(E/C) |
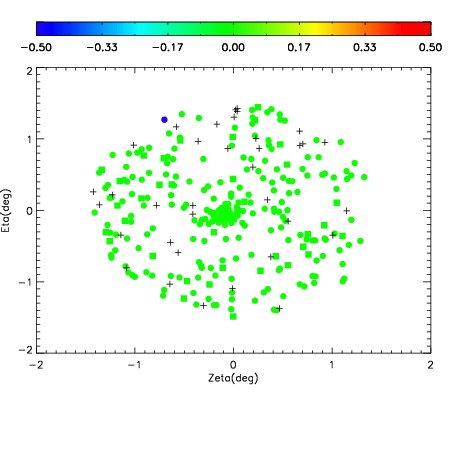
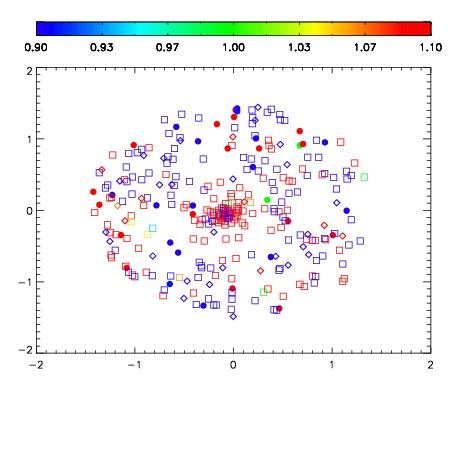
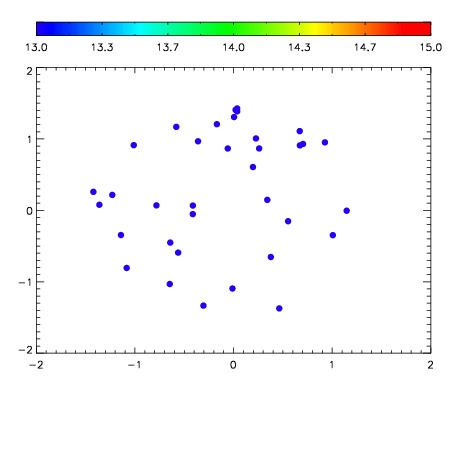

| Frame | Nreads | Zeropoints | Mag plots | Spatial mag deviation | Spatial sky 16325A emission deviations (filled: sky, open: star) | Spatial sky continuum emission | Spatial sky telluric CO2 absorption deviations (filled: H < 10) | |||||||||||||||||||||||
| 0 | 0 |
|
|
|
|
|
|
| IPAIR | NAME | SHIFT | NEWSHIFT | S/N | NAME | SHIFT | NEWSHIFT | S/N |
| 0 | 08410060 | 0.505684 | 0.00000 | 160.931 | 08410063 | 0.00135518 | 0.504329 | 160.681 |
| 1 | 08410061 | 0.504677 | 0.00100702 | 162.697 | 08410062 | 0.00154634 | 0.504138 | 161.426 |
| 2 | 08410064 | 0.502123 | 0.00356102 | 159.537 | 08410059 | 0.00000 | 0.505684 | 159.372 |
| 3 | 08410065 | 0.502859 | 0.00282502 | 157.320 | 08410066 | 0.00146477 | 0.504219 | 155.002 |