| Red | Green | Blue | |
| z | 17.64 | ||
| znorm | Inf | ||
| sky | -Inf | -Inf | -Inf |
| S/N | 26.4 | 43.1 | 48.7 |
| S/N(c) | 0.0 | 0.0 | 0.0 |
| SN(E/C) |
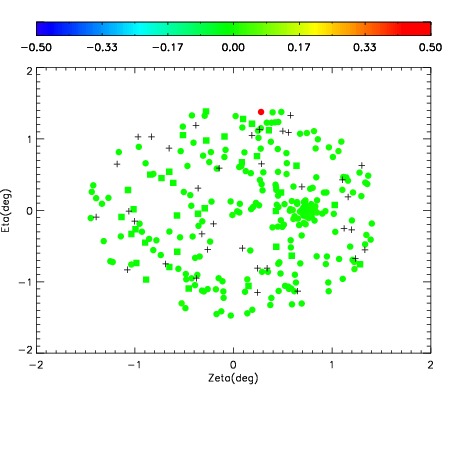
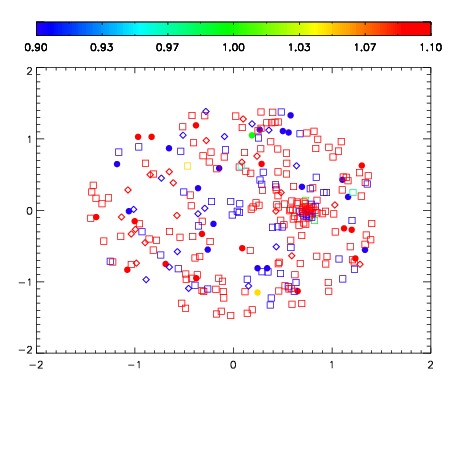
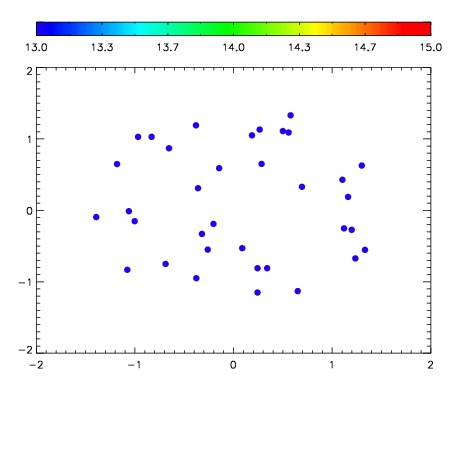

| Frame | Nreads | Zeropoints | Mag plots | Spatial mag deviation | Spatial sky 16325A emission deviations (filled: sky, open: star) | Spatial sky continuum emission | Spatial sky telluric CO2 absorption deviations (filled: H < 10) | |||||||||||||||||||||||
| 0 | 0 |
|
|
|
|
|
|
| IPAIR | NAME | SHIFT | NEWSHIFT | S/N | NAME | SHIFT | NEWSHIFT | S/N |
| 0 | 08490043 | 0.486779 | 0.00000 | 172.221 | 08490040 | 0.000760264 | 0.486019 | 168.601 |
| 1 | 08490039 | 0.481775 | 0.00500402 | 177.725 | 08490041 | 0.000487463 | 0.486292 | 171.464 |
| 2 | 08490038 | 0.481510 | 0.00526899 | 175.555 | 08490044 | 0.000371729 | 0.486407 | 171.332 |
| 3 | 08490042 | 0.485570 | 0.00120899 | 172.608 | 08490037 | 0.00000 | 0.486779 | 170.823 |