| Red | Green | Blue | |
| z | 17.64 | ||
| znorm | Inf | ||
| sky | -Inf | -Inf | -Inf |
| S/N | 19.7 | 37.1 | 38.8 |
| S/N(c) | 0.0 | 0.0 | 0.0 |
| SN(E/C) |
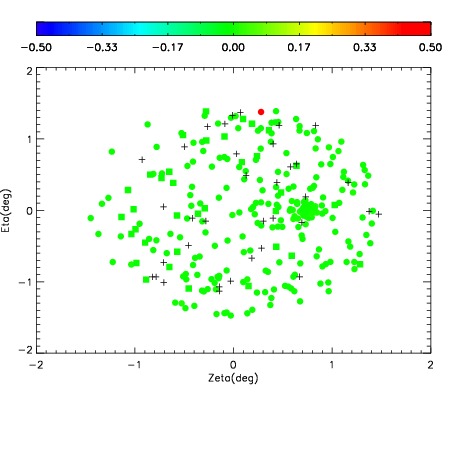
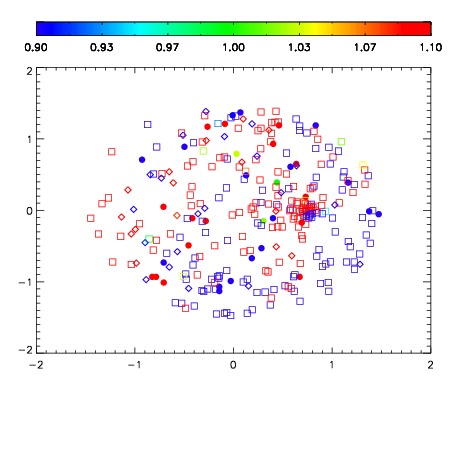
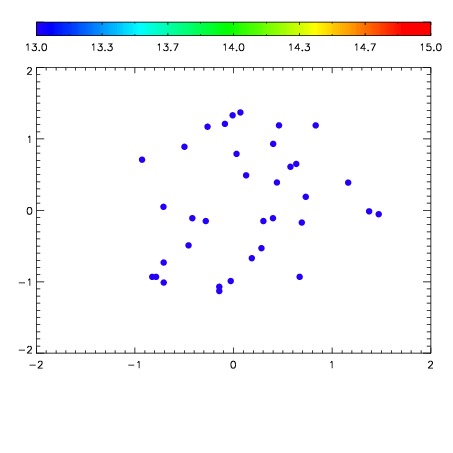

| Frame | Nreads | Zeropoints | Mag plots | Spatial mag deviation | Spatial sky 16325A emission deviations (filled: sky, open: star) | Spatial sky continuum emission | Spatial sky telluric CO2 absorption deviations (filled: H < 10) | |||||||||||||||||||||||
| 0 | 0 |
|
|
|
|
|
|
| IPAIR | NAME | SHIFT | NEWSHIFT | S/N | NAME | SHIFT | NEWSHIFT | S/N |
| 0 | 12610029 | 0.490482 | 0.00000 | 160.392 | 12610028 | -0.000480166 | 0.490962 | 152.534 |
| 1 | 12610030 | 0.489977 | 0.000505000 | 168.477 | 12610031 | 0.00196315 | 0.488519 | 168.925 |
| 2 | 12610025 | 0.488923 | 0.00155899 | 166.014 | 12610024 | 0.00000 | 0.490482 | 168.320 |
| 3 | 12610026 | 0.489292 | 0.00119001 | 162.230 | 12610027 | -0.000263551 | 0.490746 | 153.917 |