| Red | Green | Blue | |
| z | 17.64 | ||
| znorm | Inf | ||
| sky | -Inf | -Inf | -Inf |
| S/N | 8.7 | 17.0 | 18.6 |
| S/N(c) | 0.0 | 0.0 | 0.0 |
| SN(E/C) |

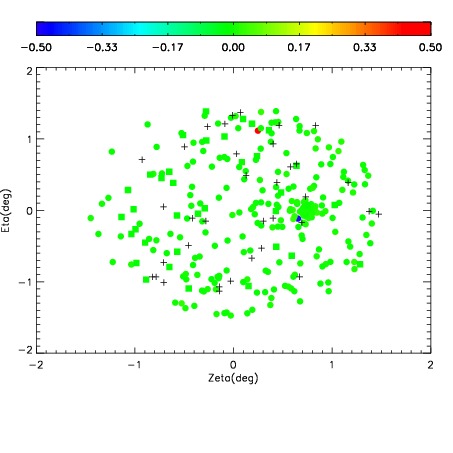
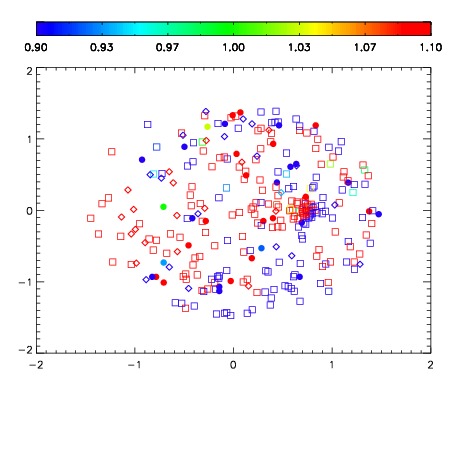
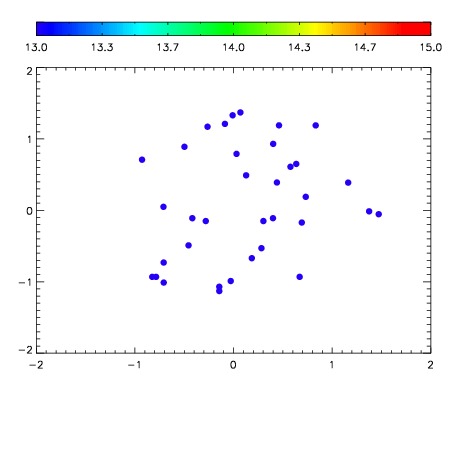

| Frame | Nreads | Zeropoints | Mag plots | Spatial mag deviation | Spatial sky 16325A emission deviations (filled: sky, open: star) | Spatial sky continuum emission | Spatial sky telluric CO2 absorption deviations (filled: H < 10) | |||||||||||||||||||||||
| 0 | 0 |
|
|
|
|
|
|
| IPAIR | NAME | SHIFT | NEWSHIFT | S/N | NAME | SHIFT | NEWSHIFT | S/N |
| 0 | 12810012 | 0.495044 | 0.00000 | 35.0328 | 12810013 | -0.00588556 | 0.500930 | 94.7794 |
| 1 | 12810020 | 0.479763 | 0.0152810 | 110.013 | 12810018 | -0.00404420 | 0.499088 | 153.619 |
| 2 | 12810019 | 0.480189 | 0.0148550 | 102.517 | 12810017 | -0.00337061 | 0.498415 | 110.627 |