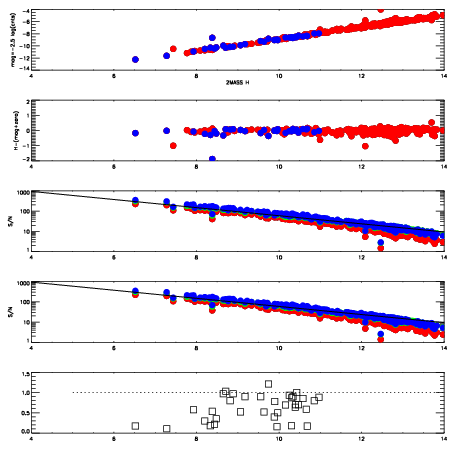
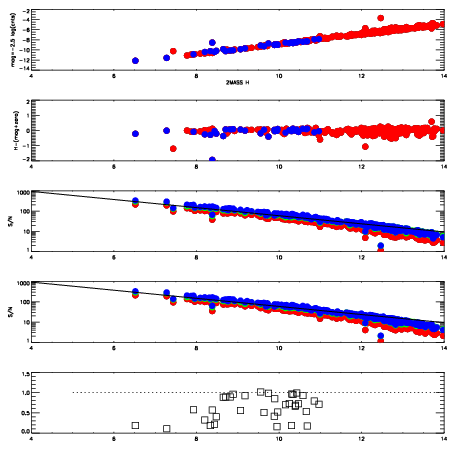
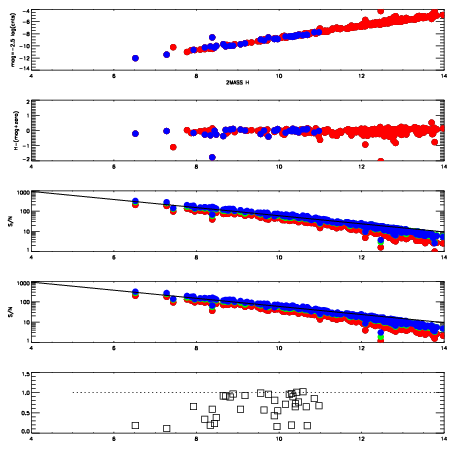
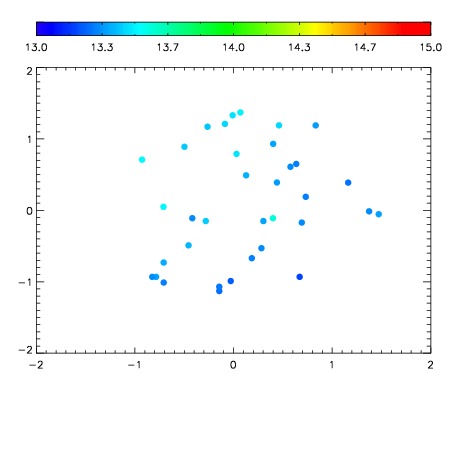
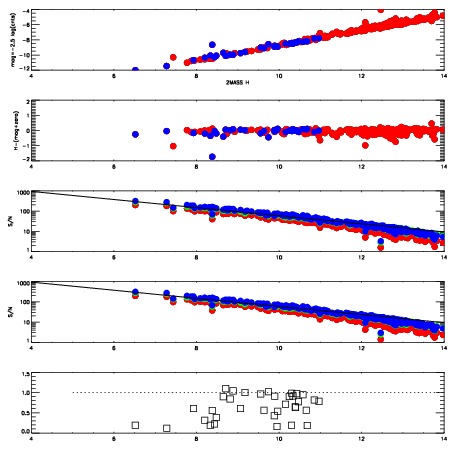
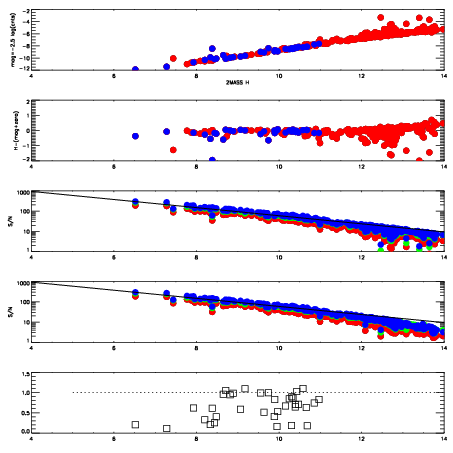
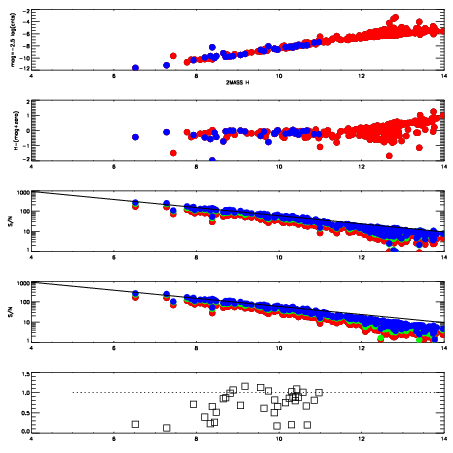
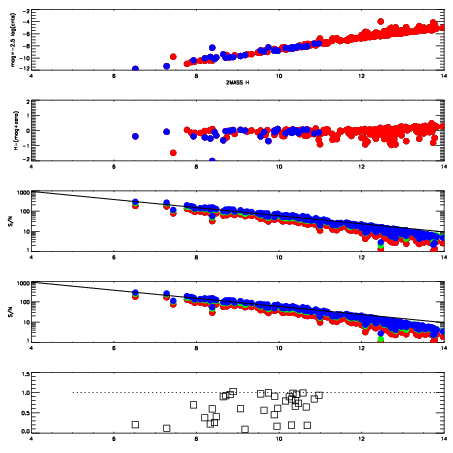
| Frame | Nreads | Zeropoints | Mag plots
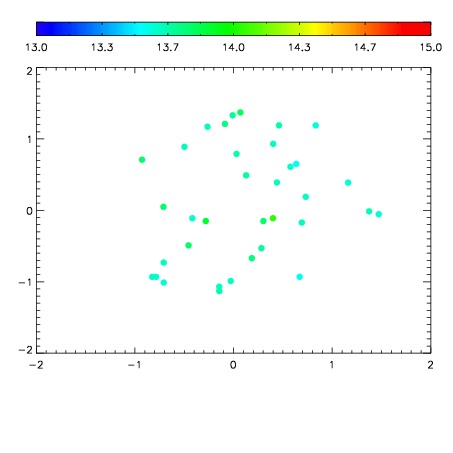
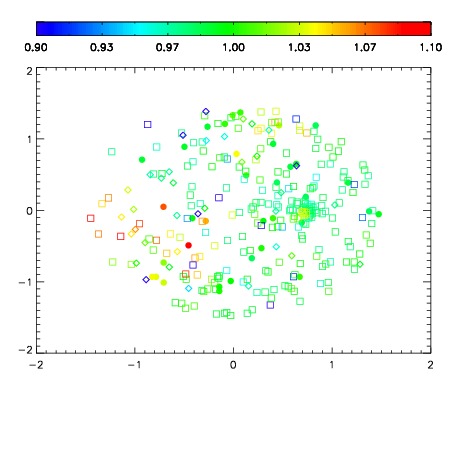
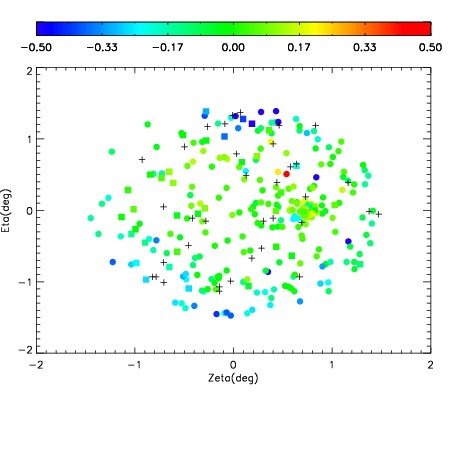
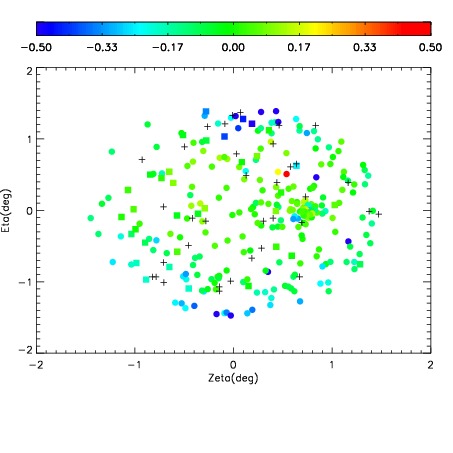
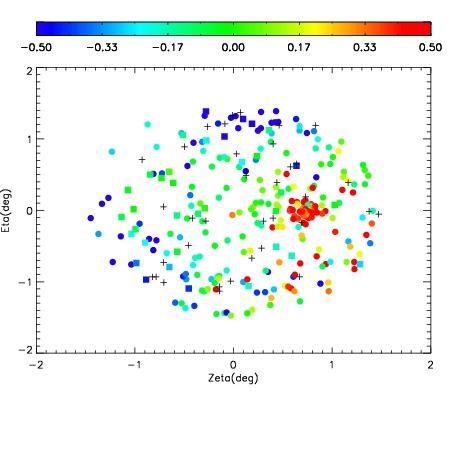
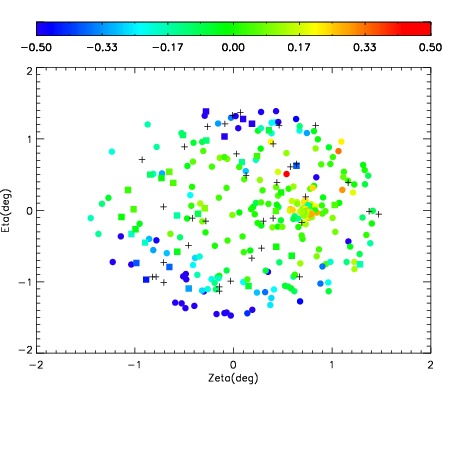
| Spatial mag deviation
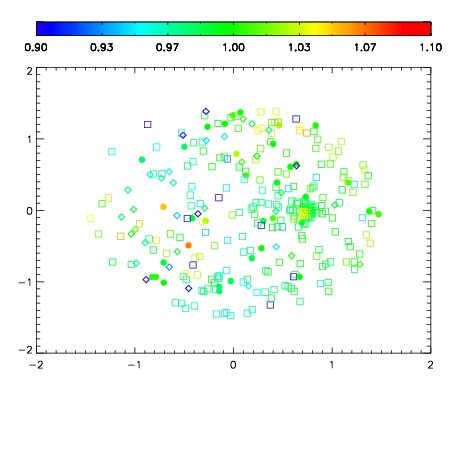
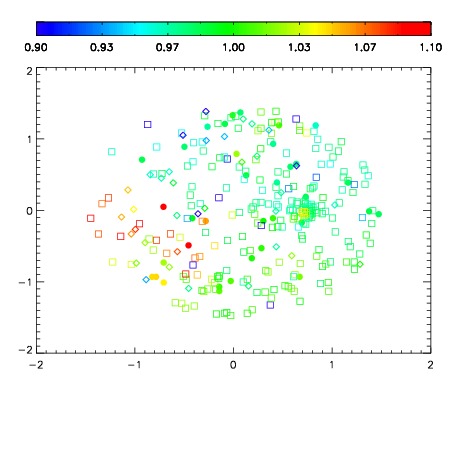
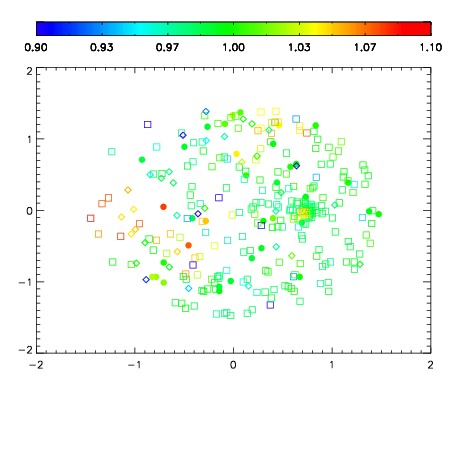
| Spatial sky 16325A emission deviations (filled: sky, open: star)
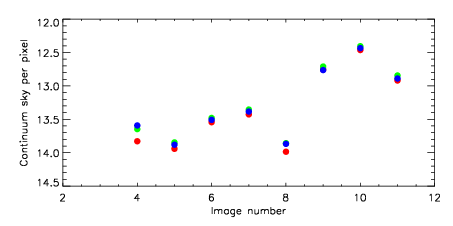
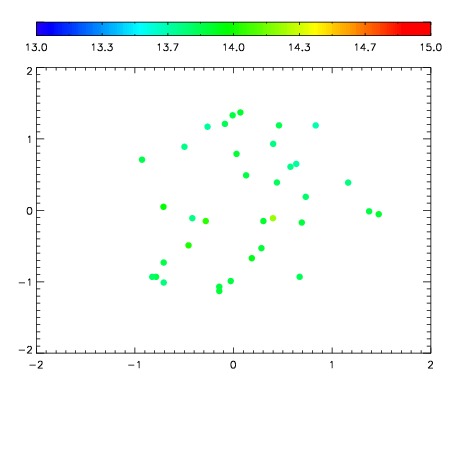
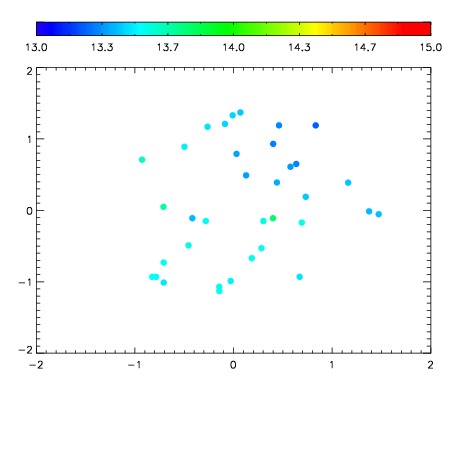
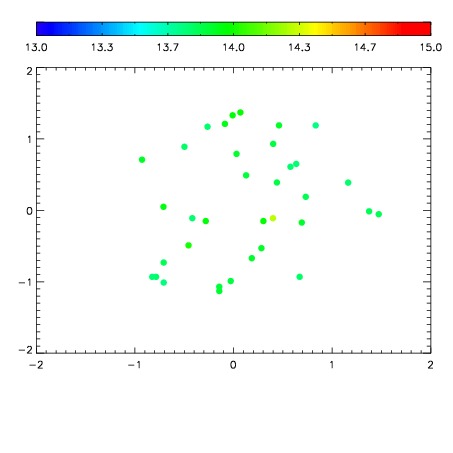
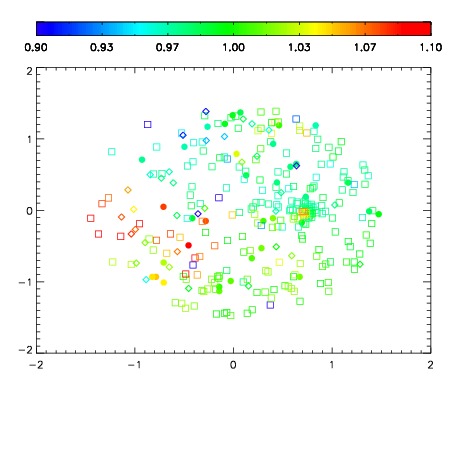
| Spatial sky continuum emission
| Spatial sky telluric CO2 absorption deviations (filled: H < 10)
|
| 12870004
| 47
| | Red | Green | Blue
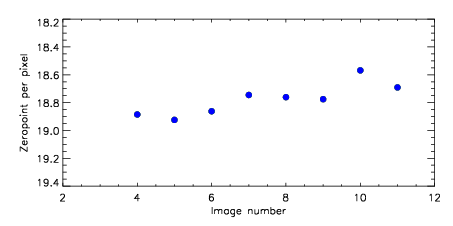
| | z | | 18.89
| | znorm | | 14.70
| | sky | 13.8 | 13.6 | 13.6
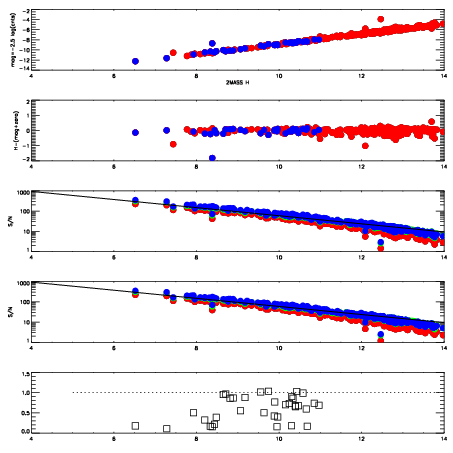
| | S/N | 11.8 | 20.6 | 21.1
| | S/N(c) | 10.2 | 18.5 | 19.7
| | SN(E/C) 0.67
|
| 
| 
| 
| 
| 
|
| 12870005
| 47
| | Red | Green | Blue
| | z | | 18.92
| | znorm | | 14.74
| | sky | 13.9 | 13.8 | 13.9
| | S/N | 11.6 | 20.7 | 21.4
| | S/N(c) | 10.2 | 18.6 | 19.9
| | SN(E/C) 0.69
|
| 
| 
| 
| 
| 
|
| 12870006
| 47
| | Red | Green | Blue
| | z | | 18.86
| | znorm | | 14.68
| | sky | 13.5 | 13.5 | 13.5
| | S/N | 10.9 | 19.2 | 20.1
| | S/N(c) | 9.7 | 17.7 | 18.9
| | SN(E/C) 0.69
|
| 
| 
| 
| 
| 
|
| 12870007
| 47
| | Red | Green | Blue
| | z | | 18.75
| | znorm | | 14.56
| | sky | 13.4 | 13.4 | 13.4
| | S/N | 9.7 | 17.5 | 18.1
| | S/N(c) | 8.2 | 15.1 | 16.1
| | SN(E/C) 0.67
|
| 
| 
| 
| 
| 
|
| 12870008
| 47
| | Red | Green | Blue
| | z | | 18.76
| | znorm | | 14.58
| | sky | 14.0 | 13.9 | 13.9
| | S/N | 10.4 | 18.9 | 19.1
| | S/N(c) | 9.1 | 17.0 | 17.7
| | SN(E/C) 0.65
|
| 
| 
| 
| 
| 
|
| 12870009
| 47
| | Red | Green | Blue
| | z | | 18.78
| | znorm | | 14.59
| | sky | 12.8 | 12.7 | 12.8
| | S/N | 9.7 | 15.6 | 16.1
| | S/N(c) | 8.1 | 14.4 | 15.0
| | SN(E/C) 0.67
|
| 
| 
| 
| 
| 
|
| 12870010
| 47
| | Red | Green | Blue
| | z | | 18.57
| | znorm | | 14.39
| | sky | 12.5 | 12.4 | 12.4
| | S/N | 8.8 | 14.9 | 15.4
| | S/N(c) | 6.0 | 9.9 | 12.2
| | SN(E/C) 0.80
|
| 
| 
| 
| 
| 
|
| 12870011
| 47
| | Red | Green | Blue
| | z | | 18.69
| | znorm | | 14.51
| | sky | 12.9 | 12.8 | 12.9
| | S/N | 8.5 | 14.5 | 14.9
| | S/N(c) | 7.0 | 12.2 | 13.6
| | SN(E/C) 0.70
|
| 
| 
| 
| 
| 
|