| Red | Green | Blue | |
| z | 17.64 | ||
| znorm | Inf | ||
| sky | -Inf | -Inf | -Inf |
| S/N | 17.4 | 31.7 | 33.8 |
| S/N(c) | 0.0 | 0.0 | 0.0 |
| SN(E/C) |
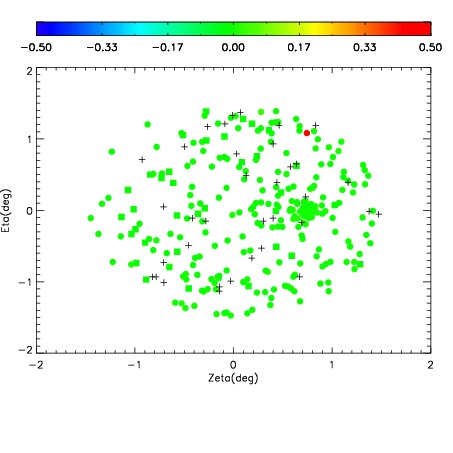
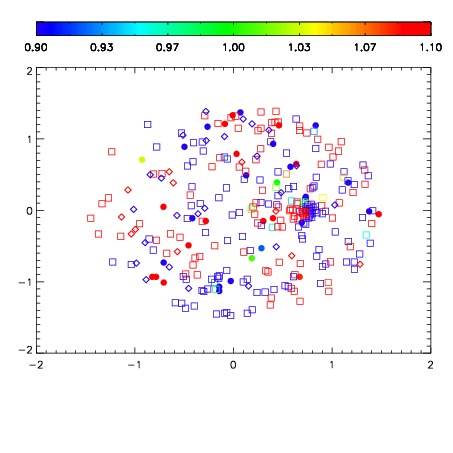
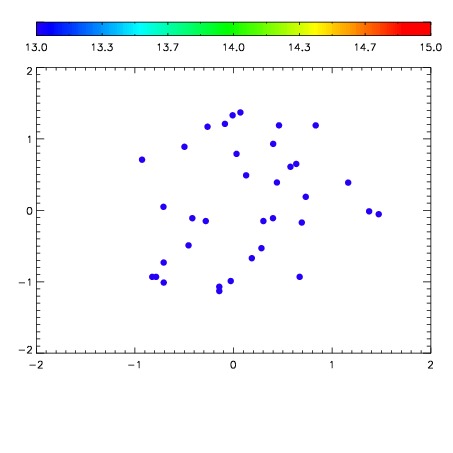

| Frame | Nreads | Zeropoints | Mag plots | Spatial mag deviation | Spatial sky 16325A emission deviations (filled: sky, open: star) | Spatial sky continuum emission | Spatial sky telluric CO2 absorption deviations (filled: H < 10) | |||||||||||||||||||||||
| 0 | 0 |
|
|
|
|
|
|
| IPAIR | NAME | SHIFT | NEWSHIFT | S/N | NAME | SHIFT | NEWSHIFT | S/N |
| 0 | 12870006 | 0.476510 | 0.00000 | 170.044 | 12870008 | -0.00499170 | 0.481502 | 163.862 |
| 1 | 12870005 | 0.475682 | 0.000827998 | 177.168 | 12870004 | 0.00000 | 0.476510 | 177.530 |
| 2 | 12870009 | 0.474113 | 0.00239700 | 161.498 | 12870007 | -0.00531113 | 0.481821 | 162.573 |
| 3 | 12870010 | 0.475479 | 0.00103098 | 139.406 | 12870011 | -0.00171060 | 0.478221 | 159.051 |