| Red | Green | Blue | |
| z | 17.64 | ||
| znorm | Inf | ||
| sky | -Inf | -Inf | -Inf |
| S/N | 21.9 | 36.7 | 39.7 |
| S/N(c) | 0.0 | 0.0 | 0.0 |
| SN(E/C) |

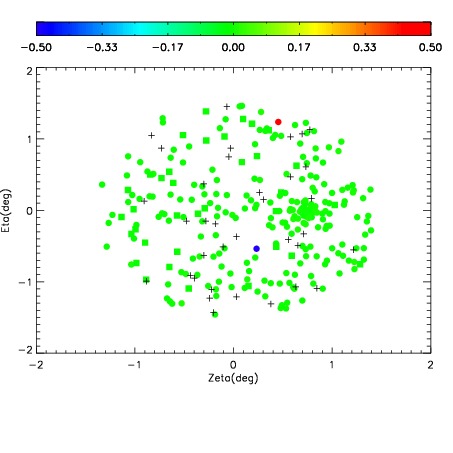
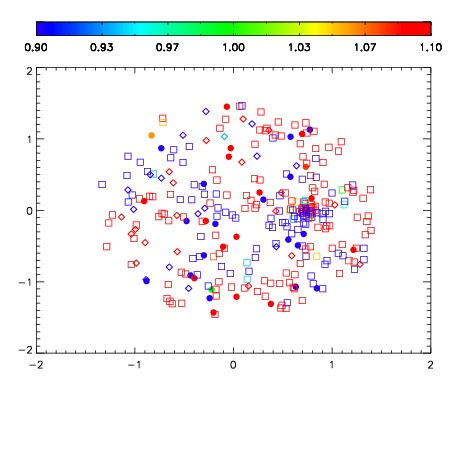
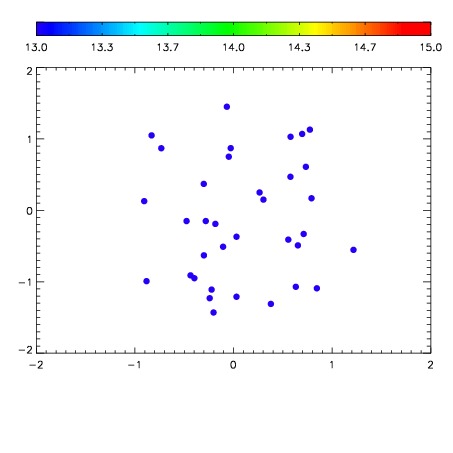

| Frame | Nreads | Zeropoints | Mag plots | Spatial mag deviation | Spatial sky 16325A emission deviations (filled: sky, open: star) | Spatial sky continuum emission | Spatial sky telluric CO2 absorption deviations (filled: H < 10) | |||||||||||||||||||||||
| 0 | 0 |
|
|
|
|
|
|
| IPAIR | NAME | SHIFT | NEWSHIFT | S/N | NAME | SHIFT | NEWSHIFT | S/N |
| 0 | 12340016 | 0.490714 | 0.00000 | 159.489 | 12340015 | -0.00529361 | 0.496008 | 156.767 |
| 1 | 12340012 | 0.488959 | 0.00175500 | 156.756 | 12340014 | -0.00560310 | 0.496317 | 153.374 |
| 2 | 12340013 | 0.489111 | 0.00160301 | 150.101 | 12340011 | 0.00000 | 0.490714 | 149.858 |