| Red | Green | Blue | |
| z | 17.64 | ||
| znorm | Inf | ||
| sky | -NaN | -NaN | -Inf |
| S/N | 10.6 | 16.3 | 22.6 |
| S/N(c) | 0.0 | 0.0 | 0.0 |
| SN(E/C) |

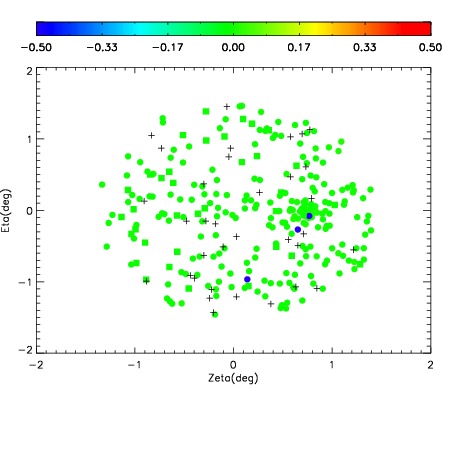
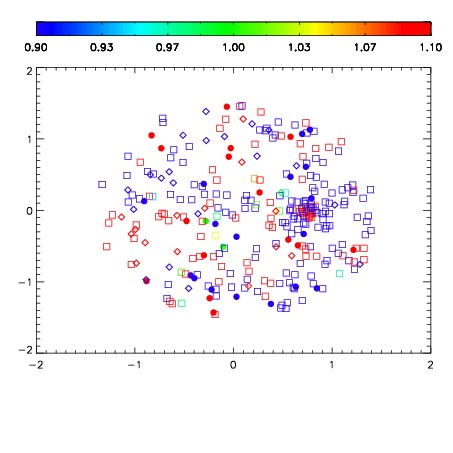
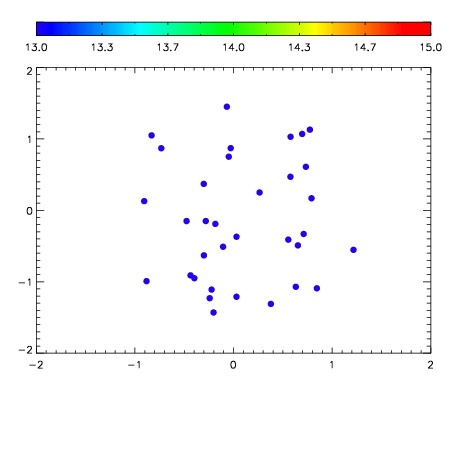

| Frame | Nreads | Zeropoints | Mag plots | Spatial mag deviation | Spatial sky 16325A emission deviations (filled: sky, open: star) | Spatial sky continuum emission | Spatial sky telluric CO2 absorption deviations (filled: H < 10) | |||||||||||||||||||||||
| 0 | 0 |
|
|
|
|
|
|
| IPAIR | NAME | SHIFT | NEWSHIFT | S/N | NAME | SHIFT | NEWSHIFT | S/N |
| 0 | 12570028 | 0.480828 | 0.00000 | 89.6793 | 12570029 | -0.00197661 | 0.482805 | 87.8989 |
| 1 | 12570023 | 0.479299 | 0.00152898 | 147.179 | 12570026 | -0.00382112 | 0.484649 | 132.820 |
| 2 | 12570027 | 0.478361 | 0.00246698 | 138.649 | 12570022 | 0.00000 | 0.480828 | 123.488 |
| 3 | 12570024 | 0.479434 | 0.00139397 | 112.874 | 12570025 | -0.00328644 | 0.484114 | 110.865 |