| Red | Green | Blue | |
| z | 17.64 | ||
| znorm | Inf | ||
| sky | -Inf | -Inf | -Inf |
| S/N | 26.0 | 43.4 | 47.4 |
| S/N(c) | 0.0 | 0.0 | 0.0 |
| SN(E/C) |

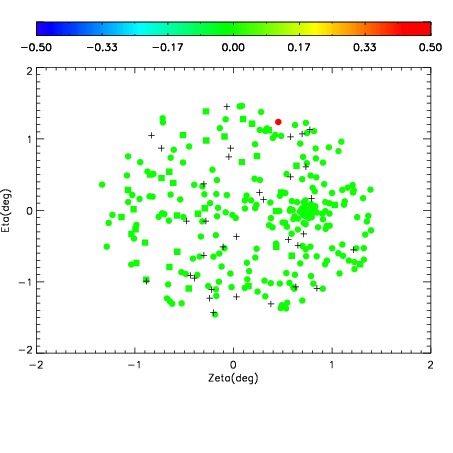
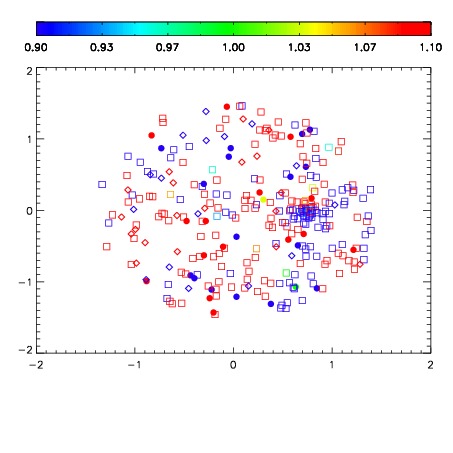
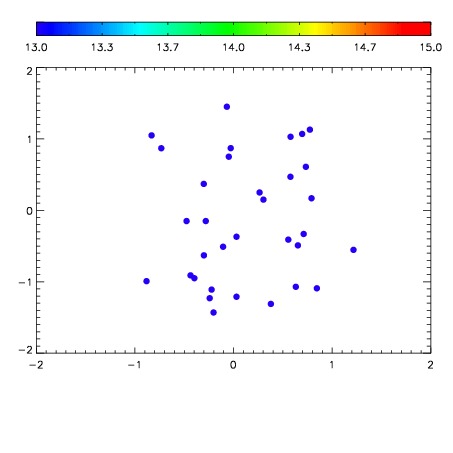

| Frame | Nreads | Zeropoints | Mag plots | Spatial mag deviation | Spatial sky 16325A emission deviations (filled: sky, open: star) | Spatial sky continuum emission | Spatial sky telluric CO2 absorption deviations (filled: H < 10) | |||||||||||||||||||||||
| 0 | 0 |
|
|
|
|
|
|
| IPAIR | NAME | SHIFT | NEWSHIFT | S/N | NAME | SHIFT | NEWSHIFT | S/N |
| 0 | 12740027 | 0.483736 | 0.00000 | 190.192 | 12740025 | -0.00471739 | 0.488453 | 193.191 |
| 1 | 12740023 | 0.483505 | 0.000230998 | 186.952 | 12740024 | -0.00488178 | 0.488618 | 190.842 |
| 2 | 12740026 | 0.482162 | 0.00157401 | 186.401 | 12740028 | -0.00165851 | 0.485395 | 189.444 |
| 3 | 12740022 | 0.483162 | 0.000574023 | 185.843 | 12740021 | 0.00000 | 0.483736 | 182.870 |