| Red | Green | Blue | |
| z | 17.63 | ||
| znorm | Inf | ||
| sky | -NaN | -NaN | -NaN |
| S/N | 4.6 | 7.4 | 8.9 |
| S/N(c) | 0.0 | 0.0 | 0.0 |
| SN(E/C) |

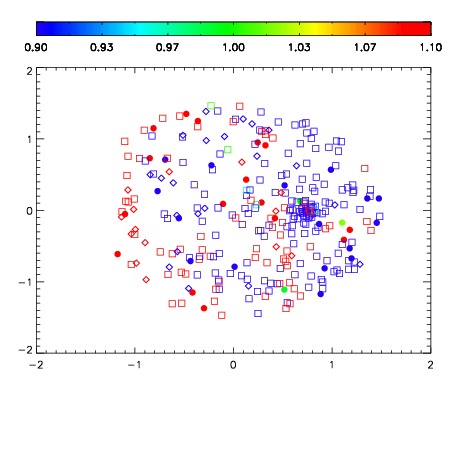
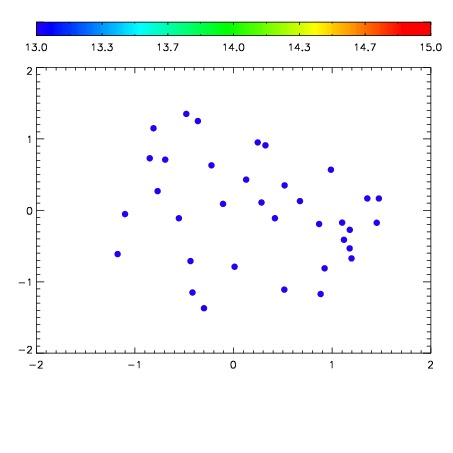

| Frame | Nreads | Zeropoints | Mag plots | Spatial mag deviation | Spatial sky 16325A emission deviations (filled: sky, open: star) | Spatial sky continuum emission | Spatial sky telluric CO2 absorption deviations (filled: H < 10) | |||||||||||||||||||||||
| 0 | 0 |
|
|
|
|
|
|
| IPAIR | NAME | SHIFT | NEWSHIFT | S/N | NAME | SHIFT | NEWSHIFT | S/N |
| 0 | 12320035 | 0.490824 | 0.00000 | 52.8370 | 12320036 | 0.00186479 | 0.488959 | 69.3025 |
| 1 | 12320039 | 0.488839 | 0.00198501 | 79.0048 | 12320040 | -0.00693175 | 0.497756 | 151.811 |
| 2 | 12320038 | 0.488437 | 0.00238702 | 63.6221 | 12320037 | 0.00196487 | 0.488859 | 69.7970 |
| 3 | 12320034 | 0.489423 | 0.00140101 | 30.6363 | 12320033 | 0.00000 | 0.490824 | 65.5398 |