| Red | Green | Blue | |
| z | 17.64 | ||
| znorm | Inf | ||
| sky | -Inf | -Inf | -Inf |
| S/N | 20.9 | 37.1 | 40.6 |
| S/N(c) | 0.0 | 0.0 | 0.0 |
| SN(E/C) |
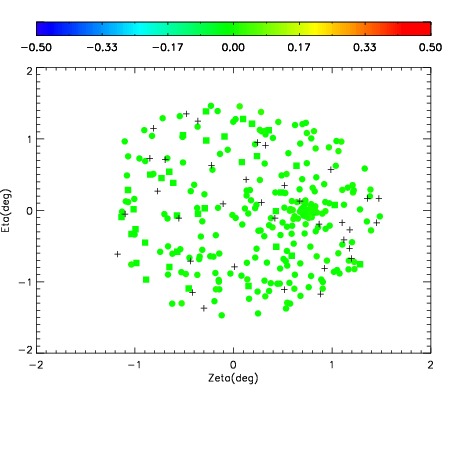
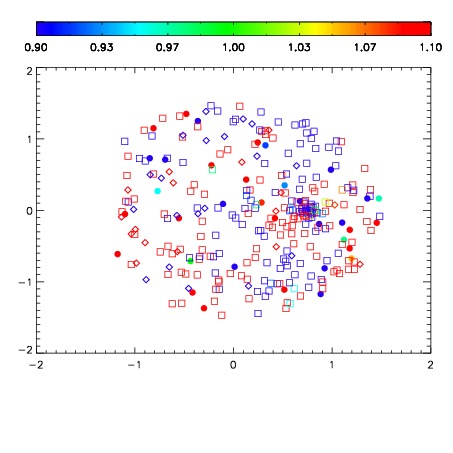
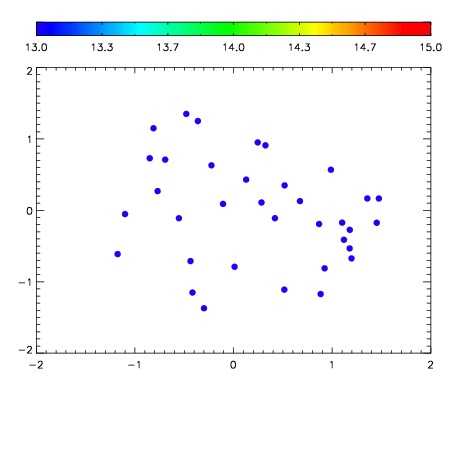

| Frame | Nreads | Zeropoints | Mag plots | Spatial mag deviation | Spatial sky 16325A emission deviations (filled: sky, open: star) | Spatial sky continuum emission | Spatial sky telluric CO2 absorption deviations (filled: H < 10) | |||||||||||||||||||||||
| 0 | 0 |
|
|
|
|
|
|
| IPAIR | NAME | SHIFT | NEWSHIFT | S/N | NAME | SHIFT | NEWSHIFT | S/N |
| 0 | 12520028 | 0.491323 | 0.00000 | 175.974 | 12520025 | 0.00622788 | 0.485095 | 186.051 |
| 1 | 12520023 | 0.489787 | 0.00153598 | 182.751 | 12520029 | -0.00361191 | 0.494935 | 186.303 |
| 2 | 12520024 | 0.489620 | 0.00170299 | 179.300 | 12520026 | 0.00615126 | 0.485172 | 186.251 |
| 3 | 12520027 | 0.490556 | 0.000766993 | 172.948 | 12520022 | 0.00000 | 0.491323 | 172.150 |