| Red | Green | Blue | |
| z | 17.64 | ||
| znorm | Inf | ||
| sky | -Inf | -Inf | -Inf |
| S/N | 25.7 | 44.4 | 48.0 |
| S/N(c) | 0.0 | 0.0 | 0.0 |
| SN(E/C) |
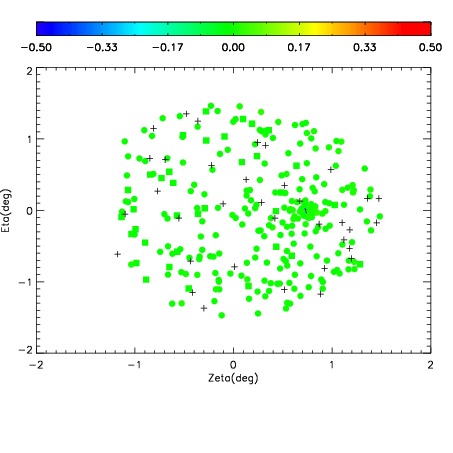
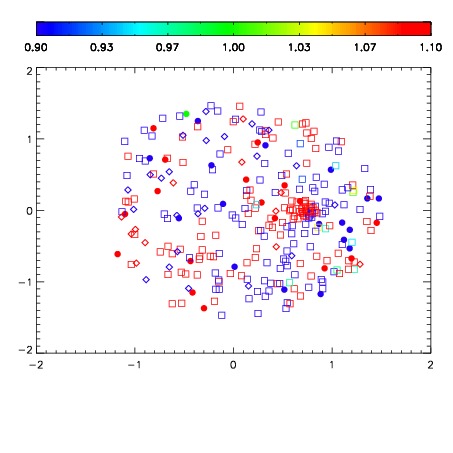
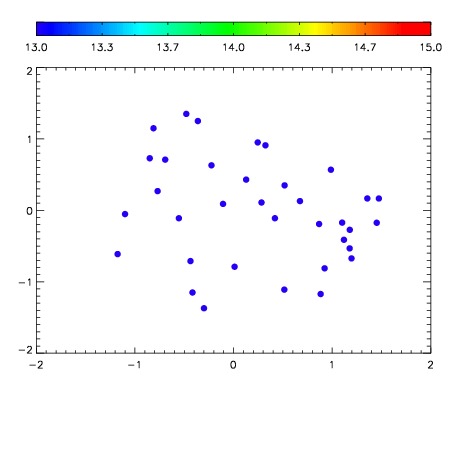

| Frame | Nreads | Zeropoints | Mag plots | Spatial mag deviation | Spatial sky 16325A emission deviations (filled: sky, open: star) | Spatial sky continuum emission | Spatial sky telluric CO2 absorption deviations (filled: H < 10) | |||||||||||||||||||||||
| 0 | 0 |
|
|
|
|
|
|
| IPAIR | NAME | SHIFT | NEWSHIFT | S/N | NAME | SHIFT | NEWSHIFT | S/N |
| 0 | 12560032 | 0.492094 | 0.00000 | 218.291 | 12560033 | -0.00136376 | 0.493458 | 221.451 |
| 1 | 12560031 | 0.491565 | 0.000529021 | 217.415 | 12560029 | -0.00260995 | 0.494704 | 216.568 |
| 2 | 12560028 | 0.491027 | 0.00106701 | 212.080 | 12560030 | -0.00242797 | 0.494522 | 215.935 |
| 3 | 12560027 | 0.491151 | 0.000943005 | 207.818 | 12560026 | 0.00000 | 0.492094 | 206.368 |