| Red | Green | Blue | |
| z | 17.64 | ||
| znorm | Inf | ||
| sky | -Inf | -Inf | -Inf |
| S/N | 22.0 | 40.3 | 42.8 |
| S/N(c) | 0.0 | 0.0 | 0.0 |
| SN(E/C) |
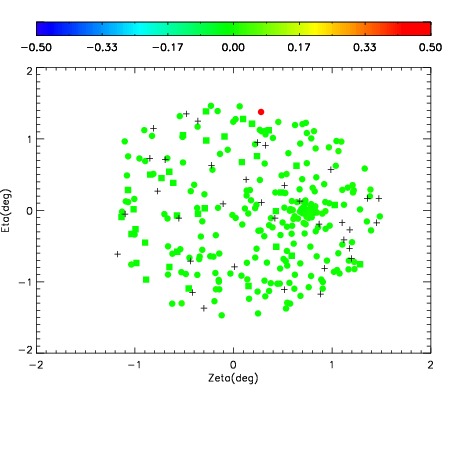

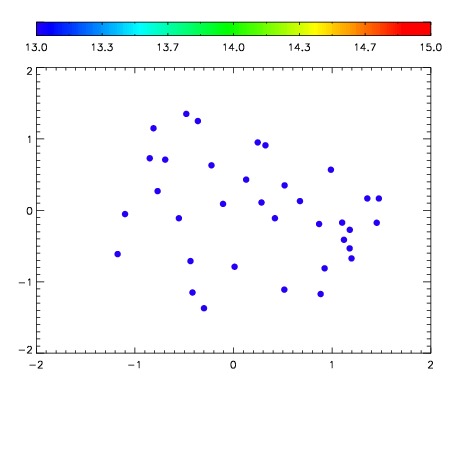

| Frame | Nreads | Zeropoints | Mag plots | Spatial mag deviation | Spatial sky 16325A emission deviations (filled: sky, open: star) | Spatial sky continuum emission | Spatial sky telluric CO2 absorption deviations (filled: H < 10) | |||||||||||||||||||||||
| 0 | 0 |
|
|
|
|
|
|
| IPAIR | NAME | SHIFT | NEWSHIFT | S/N | NAME | SHIFT | NEWSHIFT | S/N |
| 0 | 12730017 | 0.486966 | 0.00000 | 221.379 | 12730018 | -0.000427077 | 0.487393 | 223.187 |
| 1 | 12730016 | 0.486479 | 0.000487000 | 220.795 | 12730015 | -0.00177132 | 0.488737 | 216.094 |
| 2 | 12730013 | 0.485082 | 0.00188401 | 210.944 | 12730014 | -0.00176518 | 0.488731 | 210.775 |
| 3 | 12730012 | 0.482554 | 0.00441203 | 207.247 | 12730011 | 0.00000 | 0.486966 | 198.036 |