| Red | Green | Blue | |
| z | 17.64 | ||
| znorm | Inf | ||
| sky | -Inf | -Inf | -Inf |
| S/N | 23.7 | 35.9 | 37.0 |
| S/N(c) | 0.0 | 0.0 | 0.0 |
| SN(E/C) |
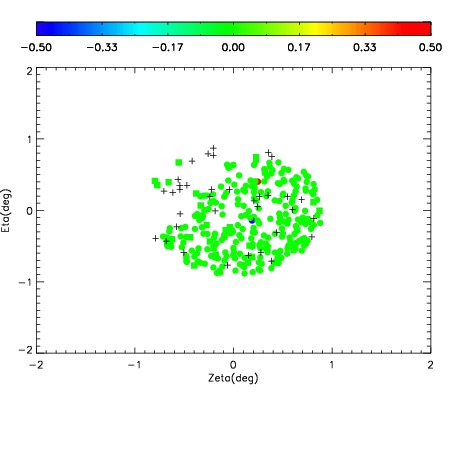
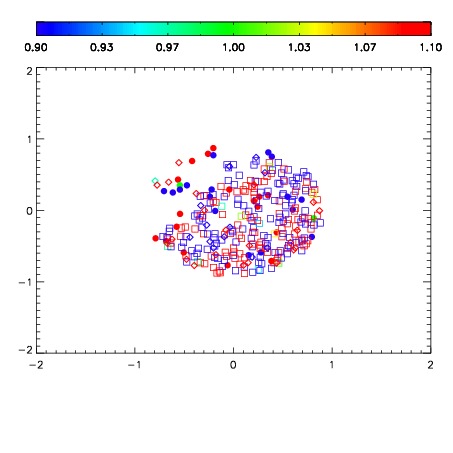
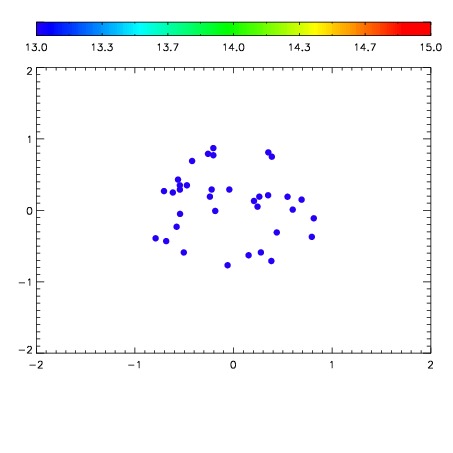

| Frame | Nreads | Zeropoints | Mag plots | Spatial mag deviation | Spatial sky 16325A emission deviations (filled: sky, open: star) | Spatial sky continuum emission | Spatial sky telluric CO2 absorption deviations (filled: H < 10) | |||||||||||||||||||||||
| 0 | 0 |
|
|
|
|
|
|
| IPAIR | NAME | SHIFT | NEWSHIFT | S/N | NAME | SHIFT | NEWSHIFT | S/N |
| 0 | 08990029 | 0.481887 | 0.00000 | 141.316 | 08990031 | 0.00280685 | 0.479080 | 140.128 |
| 1 | 08990033 | 0.480580 | 0.00130701 | 160.166 | 08990034 | 0.00378392 | 0.478103 | 155.551 |
| 2 | 08990032 | 0.479679 | 0.00220802 | 141.932 | 08990030 | 0.00386683 | 0.478020 | 147.348 |
| 3 | 08990028 | 0.481586 | 0.000301003 | 133.445 | 08990027 | 0.00000 | 0.481887 | 133.238 |