| Red | Green | Blue | |
| z | 17.64 | ||
| znorm | Inf | ||
| sky | -Inf | -NaN | -Inf |
| S/N | 33.8 | 49.2 | 52.7 |
| S/N(c) | 0.0 | 0.0 | 0.0 |
| SN(E/C) |
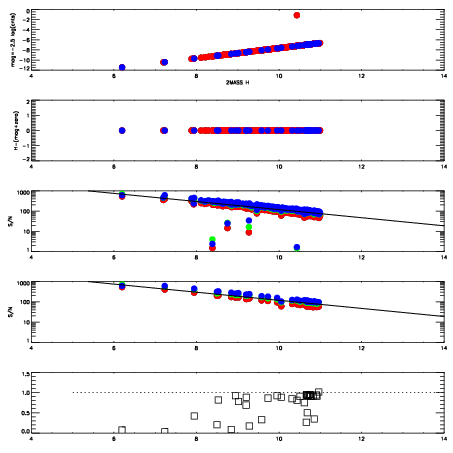

| Frame | Nreads | Zeropoints | Mag plots | Spatial mag deviation | Spatial sky 16325A emission deviations (filled: sky, open: star) | Spatial sky continuum emission | Spatial sky telluric CO2 absorption deviations (filled: H < 10) | |||||||||||||||||||||||
| 0 | 0 |
|
|
|
|
|
|
| IPAIR | NAME | SHIFT | NEWSHIFT | S/N | NAME | SHIFT | NEWSHIFT | S/N |
| 0 | 09080043 | 0.480296 | 0.00000 | 200.255 | 09080041 | 0.00331200 | 0.476984 | 199.150 |
| 1 | 09080039 | 0.477362 | 0.00293398 | 203.984 | 09080044 | 0.00636564 | 0.473930 | 206.547 |
| 2 | 09080042 | 0.478143 | 0.00215298 | 203.565 | 09080040 | 0.00376657 | 0.476529 | 202.738 |
| 3 | 09080038 | 0.476364 | 0.00393200 | 201.913 | 09080037 | 0.00000 | 0.480296 | 199.620 |