| Red | Green | Blue | |
| z | 17.64 | ||
| znorm | Inf | ||
| sky | -Inf | -Inf | -Inf |
| S/N | 34.1 | 50.9 | 55.0 |
| S/N(c) | 0.0 | 0.0 | 0.0 |
| SN(E/C) |
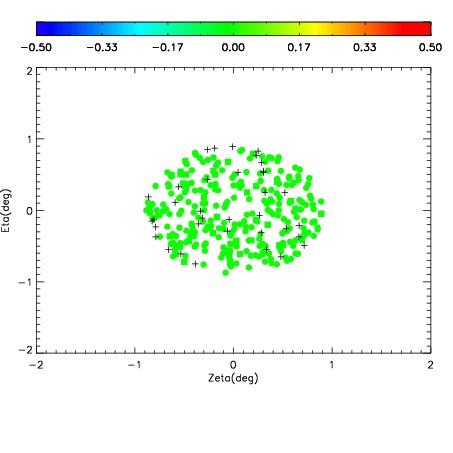
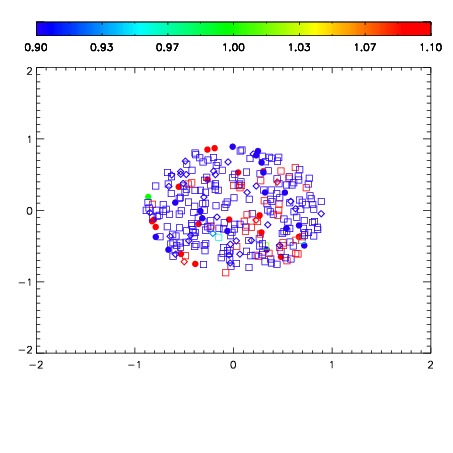
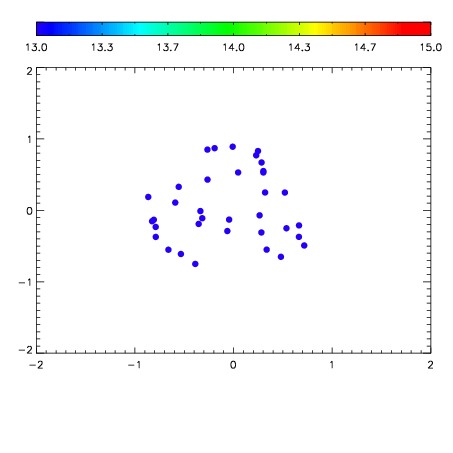

| Frame | Nreads | Zeropoints | Mag plots | Spatial mag deviation | Spatial sky 16325A emission deviations (filled: sky, open: star) | Spatial sky continuum emission | Spatial sky telluric CO2 absorption deviations (filled: H < 10) | |||||||||||||||||||||||
| 0 | 0 |
|
|
|
|
|
|
| IPAIR | NAME | SHIFT | NEWSHIFT | S/N | NAME | SHIFT | NEWSHIFT | S/N |
| 0 | 08420072 | 0.481056 | 0.00000 | 238.283 | 08420073 | 0.00637125 | 0.474685 | 235.429 |
| 1 | 08420075 | 0.478267 | 0.00278899 | 246.120 | 08420077 | 0.00271882 | 0.478337 | 244.378 |
| 2 | 08420076 | 0.478919 | 0.00213701 | 245.130 | 08420074 | 0.000391353 | 0.480665 | 238.467 |
| 3 | 08420071 | 0.480086 | 0.000970006 | 232.999 | 08420070 | 0.00000 | 0.481056 | 229.531 |